Guyanese vs Vietnamese Per Capita Income
COMPARE
Guyanese
Vietnamese
Per Capita Income
Per Capita Income Comparison
Guyanese
Vietnamese
$40,949
PER CAPITA INCOME
4.5/ 100
METRIC RATING
232nd/ 347
METRIC RANK
$42,368
PER CAPITA INCOME
19.0/ 100
METRIC RATING
200th/ 347
METRIC RANK
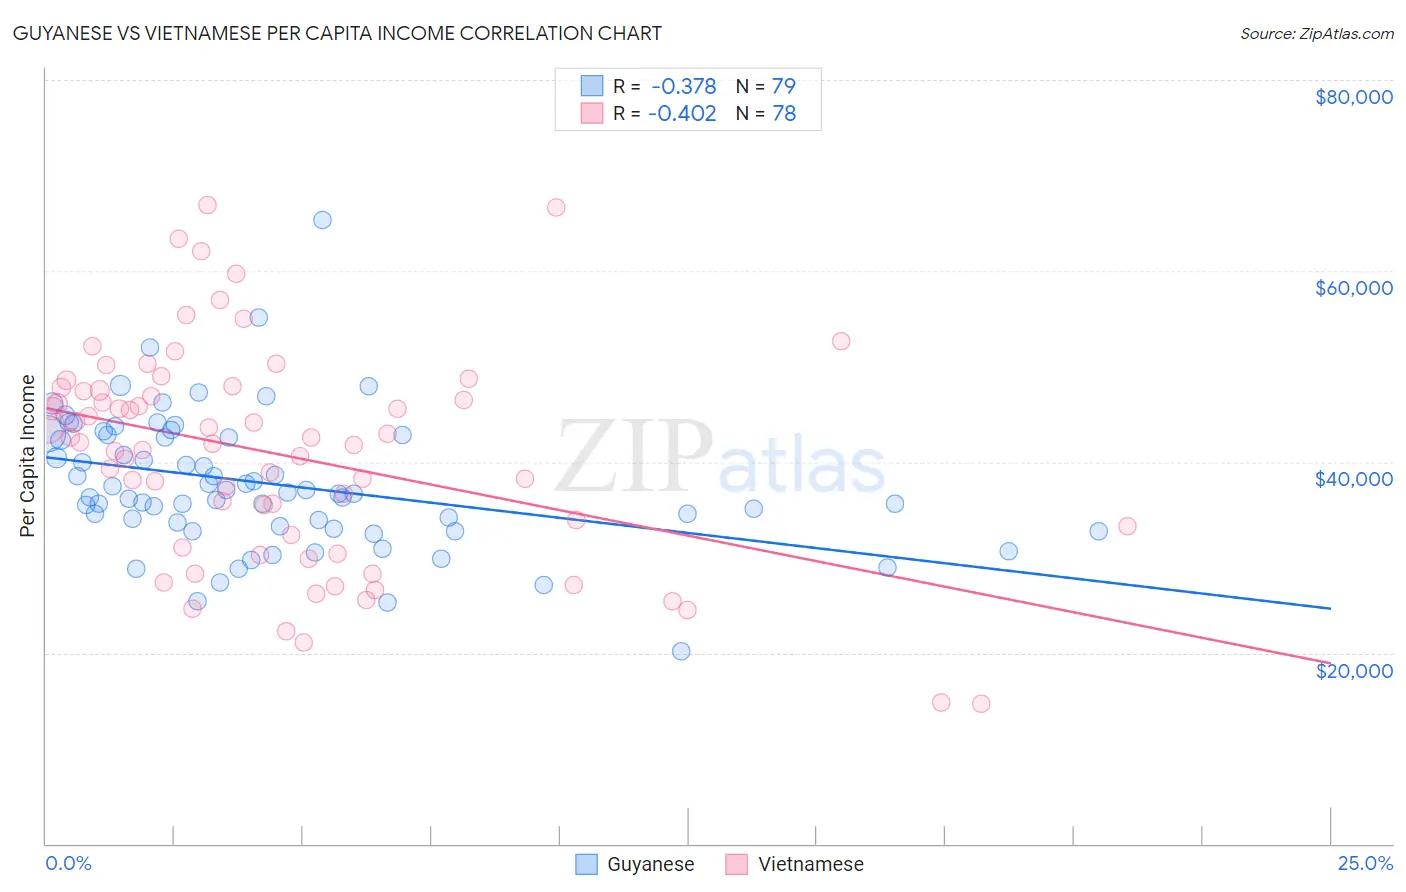
Guyanese vs Vietnamese Per Capita Income Correlation Chart
The statistical analysis conducted on geographies consisting of 176,945,802 people shows a mild negative correlation between the proportion of Guyanese and per capita income in the United States with a correlation coefficient (R) of -0.378 and weighted average of $40,949. Similarly, the statistical analysis conducted on geographies consisting of 170,759,165 people shows a moderate negative correlation between the proportion of Vietnamese and per capita income in the United States with a correlation coefficient (R) of -0.402 and weighted average of $42,368, a difference of 3.5%.
Per Capita Income Correlation Summary
| Measurement | Guyanese | Vietnamese |
| Minimum | $20,131 | $14,629 |
| Maximum | $65,314 | $66,907 |
| Range | $45,183 | $52,278 |
| Mean | $37,694 | $40,731 |
| Median | $36,719 | $41,985 |
| Interquartile 25% (IQ1) | $33,285 | $32,361 |
| Interquartile 75% (IQ3) | $42,829 | $47,484 |
| Interquartile Range (IQR) | $9,544 | $15,123 |
| Standard Deviation (Sample) | $7,132 | $11,295 |
| Standard Deviation (Population) | $7,087 | $11,222 |
Similar Demographics by Per Capita Income
Demographics Similar to Guyanese by Per Capita Income
In terms of per capita income, the demographic groups most similar to Guyanese are Senegalese ($41,000, a difference of 0.12%), Native Hawaiian ($41,017, a difference of 0.16%), Nigerian ($41,026, a difference of 0.19%), Immigrants from Grenada ($41,123, a difference of 0.42%), and Delaware ($40,778, a difference of 0.42%).
| Demographics | Rating | Rank | Per Capita Income |
| West Indians | 6.0 /100 | #225 | Tragic $41,217 |
| Immigrants | Ecuador | 5.9 /100 | #226 | Tragic $41,195 |
| Immigrants | Ghana | 5.5 /100 | #227 | Tragic $41,131 |
| Immigrants | Grenada | 5.5 /100 | #228 | Tragic $41,123 |
| Nigerians | 4.9 /100 | #229 | Tragic $41,026 |
| Native Hawaiians | 4.9 /100 | #230 | Tragic $41,017 |
| Senegalese | 4.8 /100 | #231 | Tragic $41,000 |
| Guyanese | 4.5 /100 | #232 | Tragic $40,949 |
| Delaware | 3.8 /100 | #233 | Tragic $40,778 |
| Immigrants | West Indies | 3.7 /100 | #234 | Tragic $40,763 |
| Immigrants | Guyana | 3.6 /100 | #235 | Tragic $40,742 |
| Immigrants | Nonimmigrants | 3.4 /100 | #236 | Tragic $40,669 |
| Immigrants | Cambodia | 2.6 /100 | #237 | Tragic $40,434 |
| Somalis | 2.4 /100 | #238 | Tragic $40,367 |
| Tsimshian | 2.4 /100 | #239 | Tragic $40,344 |
Demographics Similar to Vietnamese by Per Capita Income
In terms of per capita income, the demographic groups most similar to Vietnamese are Barbadian ($42,406, a difference of 0.090%), Immigrants from Portugal ($42,412, a difference of 0.10%), Immigrants from Thailand ($42,289, a difference of 0.19%), Immigrants from Bosnia and Herzegovina ($42,278, a difference of 0.21%), and Spanish ($42,249, a difference of 0.28%).
| Demographics | Rating | Rank | Per Capita Income |
| Immigrants | Sierra Leone | 26.5 /100 | #193 | Fair $42,752 |
| Immigrants | Fiji | 25.2 /100 | #194 | Fair $42,694 |
| Immigrants | Kenya | 24.5 /100 | #195 | Fair $42,661 |
| Dutch | 23.4 /100 | #196 | Fair $42,605 |
| Scotch-Irish | 22.6 /100 | #197 | Fair $42,563 |
| Immigrants | Portugal | 19.7 /100 | #198 | Poor $42,412 |
| Barbadians | 19.6 /100 | #199 | Poor $42,406 |
| Vietnamese | 19.0 /100 | #200 | Poor $42,368 |
| Immigrants | Thailand | 17.6 /100 | #201 | Poor $42,289 |
| Immigrants | Bosnia and Herzegovina | 17.5 /100 | #202 | Poor $42,278 |
| Spanish | 17.0 /100 | #203 | Poor $42,249 |
| Aleuts | 16.4 /100 | #204 | Poor $42,210 |
| Whites/Caucasians | 15.9 /100 | #205 | Poor $42,180 |
| Ghanaians | 15.7 /100 | #206 | Poor $42,164 |
| Venezuelans | 14.4 /100 | #207 | Poor $42,074 |