Immigrants from Thailand vs Vietnamese Per Capita Income
COMPARE
Immigrants from Thailand
Vietnamese
Per Capita Income
Per Capita Income Comparison
Immigrants from Thailand
Vietnamese
$42,289
PER CAPITA INCOME
17.6/ 100
METRIC RATING
201st/ 347
METRIC RANK
$42,368
PER CAPITA INCOME
19.0/ 100
METRIC RATING
200th/ 347
METRIC RANK
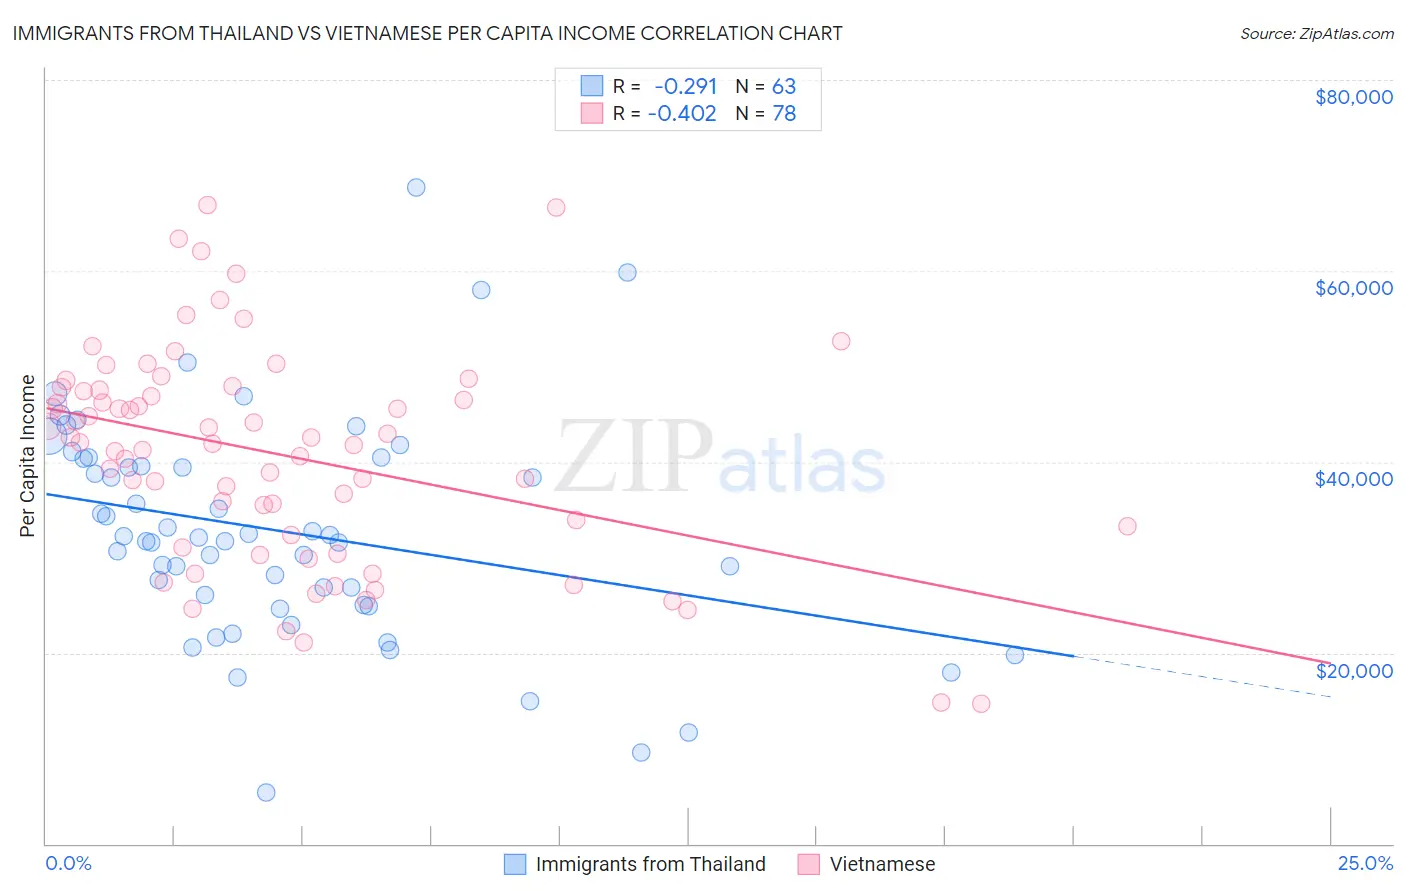
Immigrants from Thailand vs Vietnamese Per Capita Income Correlation Chart
The statistical analysis conducted on geographies consisting of 317,026,349 people shows a weak negative correlation between the proportion of Immigrants from Thailand and per capita income in the United States with a correlation coefficient (R) of -0.291 and weighted average of $42,289. Similarly, the statistical analysis conducted on geographies consisting of 170,759,165 people shows a moderate negative correlation between the proportion of Vietnamese and per capita income in the United States with a correlation coefficient (R) of -0.402 and weighted average of $42,368, a difference of 0.19%.
Per Capita Income Correlation Summary
| Measurement | Immigrants from Thailand | Vietnamese |
| Minimum | $5,324 | $14,629 |
| Maximum | $68,712 | $66,907 |
| Range | $63,388 | $52,278 |
| Mean | $32,742 | $40,731 |
| Median | $32,020 | $41,985 |
| Interquartile 25% (IQ1) | $24,989 | $32,361 |
| Interquartile 75% (IQ3) | $40,306 | $47,484 |
| Interquartile Range (IQR) | $15,317 | $15,123 |
| Standard Deviation (Sample) | $11,676 | $11,295 |
| Standard Deviation (Population) | $11,583 | $11,222 |
Demographics Similar to Immigrants from Thailand and Vietnamese by Per Capita Income
In terms of per capita income, the demographic groups most similar to Immigrants from Thailand are Immigrants from Bosnia and Herzegovina ($42,278, a difference of 0.030%), Spanish ($42,249, a difference of 0.090%), Aleut ($42,210, a difference of 0.19%), White/Caucasian ($42,180, a difference of 0.26%), and Barbadian ($42,406, a difference of 0.28%). Similarly, the demographic groups most similar to Vietnamese are Barbadian ($42,406, a difference of 0.090%), Immigrants from Portugal ($42,412, a difference of 0.10%), Immigrants from Bosnia and Herzegovina ($42,278, a difference of 0.21%), Spanish ($42,249, a difference of 0.28%), and Aleut ($42,210, a difference of 0.37%).
| Demographics | Rating | Rank | Per Capita Income |
| Kenyans | 27.7 /100 | #190 | Fair $42,808 |
| Yugoslavians | 27.4 /100 | #191 | Fair $42,792 |
| Iraqis | 26.7 /100 | #192 | Fair $42,760 |
| Immigrants | Sierra Leone | 26.5 /100 | #193 | Fair $42,752 |
| Immigrants | Fiji | 25.2 /100 | #194 | Fair $42,694 |
| Immigrants | Kenya | 24.5 /100 | #195 | Fair $42,661 |
| Dutch | 23.4 /100 | #196 | Fair $42,605 |
| Scotch-Irish | 22.6 /100 | #197 | Fair $42,563 |
| Immigrants | Portugal | 19.7 /100 | #198 | Poor $42,412 |
| Barbadians | 19.6 /100 | #199 | Poor $42,406 |
| Vietnamese | 19.0 /100 | #200 | Poor $42,368 |
| Immigrants | Thailand | 17.6 /100 | #201 | Poor $42,289 |
| Immigrants | Bosnia and Herzegovina | 17.5 /100 | #202 | Poor $42,278 |
| Spanish | 17.0 /100 | #203 | Poor $42,249 |
| Aleuts | 16.4 /100 | #204 | Poor $42,210 |
| Whites/Caucasians | 15.9 /100 | #205 | Poor $42,180 |
| Ghanaians | 15.7 /100 | #206 | Poor $42,164 |
| Venezuelans | 14.4 /100 | #207 | Poor $42,074 |
| Panamanians | 13.9 /100 | #208 | Poor $42,035 |
| Immigrants | Sudan | 13.2 /100 | #209 | Poor $41,986 |
| Ecuadorians | 12.9 /100 | #210 | Poor $41,958 |