Guyanese vs Vietnamese Unemployment Among Seniors over 65 years
COMPARE
Guyanese
Vietnamese
Unemployment Among Seniors over 65 years
Unemployment Among Seniors over 65 years Comparison
Guyanese
Vietnamese
5.6%
UNEMPLOYMENT AMONG SENIORS OVER 65 YEARS
0.0/ 100
METRIC RATING
299th/ 347
METRIC RANK
5.7%
UNEMPLOYMENT AMONG SENIORS OVER 65 YEARS
0.0/ 100
METRIC RATING
318th/ 347
METRIC RANK
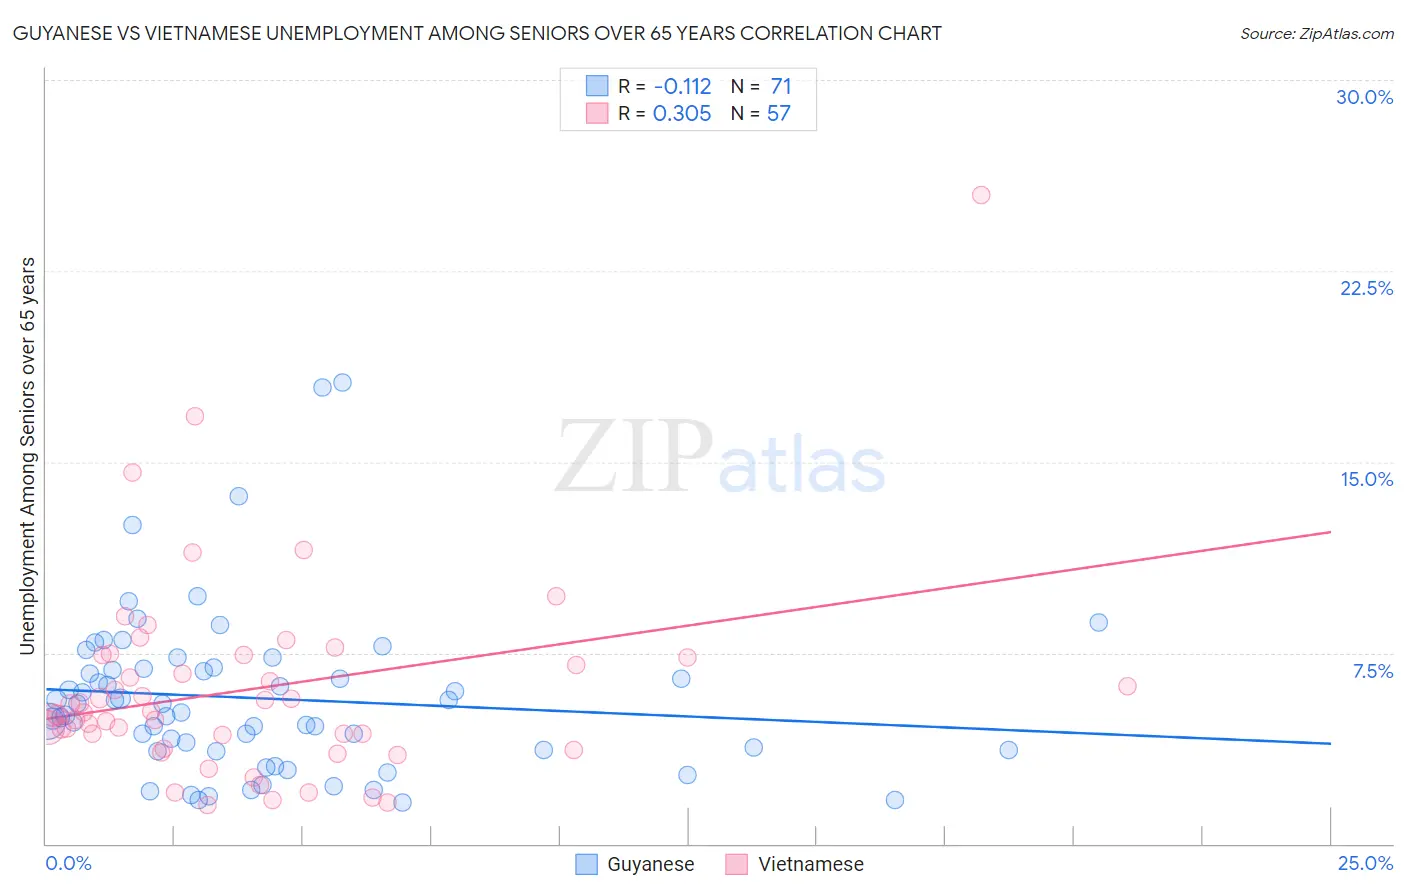
Guyanese vs Vietnamese Unemployment Among Seniors over 65 years Correlation Chart
The statistical analysis conducted on geographies consisting of 168,241,016 people shows a poor negative correlation between the proportion of Guyanese and unemployment rate amomg seniors over the age of 65 in the United States with a correlation coefficient (R) of -0.112 and weighted average of 5.6%. Similarly, the statistical analysis conducted on geographies consisting of 164,265,212 people shows a mild positive correlation between the proportion of Vietnamese and unemployment rate amomg seniors over the age of 65 in the United States with a correlation coefficient (R) of 0.305 and weighted average of 5.7%, a difference of 2.7%.
Unemployment Among Seniors over 65 years Correlation Summary
| Measurement | Guyanese | Vietnamese |
| Minimum | 1.6% | 1.5% |
| Maximum | 18.1% | 25.5% |
| Range | 16.5% | 24.0% |
| Mean | 5.7% | 6.0% |
| Median | 5.1% | 5.2% |
| Interquartile 25% (IQ1) | 3.7% | 4.0% |
| Interquartile 75% (IQ3) | 6.9% | 7.3% |
| Interquartile Range (IQR) | 3.2% | 3.4% |
| Standard Deviation (Sample) | 3.2% | 4.0% |
| Standard Deviation (Population) | 3.2% | 3.9% |
Demographics Similar to Guyanese and Vietnamese by Unemployment Among Seniors over 65 years
In terms of unemployment among seniors over 65 years, the demographic groups most similar to Guyanese are Zimbabwean (5.6%, a difference of 0.050%), Immigrants from West Indies (5.6%, a difference of 0.090%), Hispanic or Latino (5.6%, a difference of 0.26%), Guatemalan (5.6%, a difference of 0.42%), and Immigrants from Latin America (5.6%, a difference of 0.51%). Similarly, the demographic groups most similar to Vietnamese are Immigrants from Bahamas (5.7%, a difference of 0.32%), Immigrants from Central America (5.7%, a difference of 0.43%), Immigrants from El Salvador (5.7%, a difference of 0.62%), Delaware (5.7%, a difference of 0.65%), and Barbadian (5.6%, a difference of 1.2%).
| Demographics | Rating | Rank | Unemployment Among Seniors over 65 years |
| Immigrants | West Indies | 0.0 /100 | #298 | Tragic 5.6% |
| Guyanese | 0.0 /100 | #299 | Tragic 5.6% |
| Zimbabweans | 0.0 /100 | #300 | Tragic 5.6% |
| Hispanics or Latinos | 0.0 /100 | #301 | Tragic 5.6% |
| Guatemalans | 0.0 /100 | #302 | Tragic 5.6% |
| Immigrants | Latin America | 0.0 /100 | #303 | Tragic 5.6% |
| Liberians | 0.0 /100 | #304 | Tragic 5.6% |
| Mexicans | 0.0 /100 | #305 | Tragic 5.6% |
| Ecuadorians | 0.0 /100 | #306 | Tragic 5.6% |
| Portuguese | 0.0 /100 | #307 | Tragic 5.6% |
| Immigrants | St. Vincent and the Grenadines | 0.0 /100 | #308 | Tragic 5.6% |
| Immigrants | Guatemala | 0.0 /100 | #309 | Tragic 5.6% |
| Salvadorans | 0.0 /100 | #310 | Tragic 5.6% |
| Immigrants | Guyana | 0.0 /100 | #311 | Tragic 5.6% |
| Immigrants | Ecuador | 0.0 /100 | #312 | Tragic 5.6% |
| Barbadians | 0.0 /100 | #313 | Tragic 5.6% |
| Delaware | 0.0 /100 | #314 | Tragic 5.7% |
| Immigrants | El Salvador | 0.0 /100 | #315 | Tragic 5.7% |
| Immigrants | Central America | 0.0 /100 | #316 | Tragic 5.7% |
| Immigrants | Bahamas | 0.0 /100 | #317 | Tragic 5.7% |
| Vietnamese | 0.0 /100 | #318 | Tragic 5.7% |