Guyanese vs Immigrants from Middle Africa Per Capita Income
COMPARE
Guyanese
Immigrants from Middle Africa
Per Capita Income
Per Capita Income Comparison
Guyanese
Immigrants from Middle Africa
$40,949
PER CAPITA INCOME
4.5/ 100
METRIC RATING
232nd/ 347
METRIC RANK
$39,529
PER CAPITA INCOME
1.0/ 100
METRIC RATING
255th/ 347
METRIC RANK
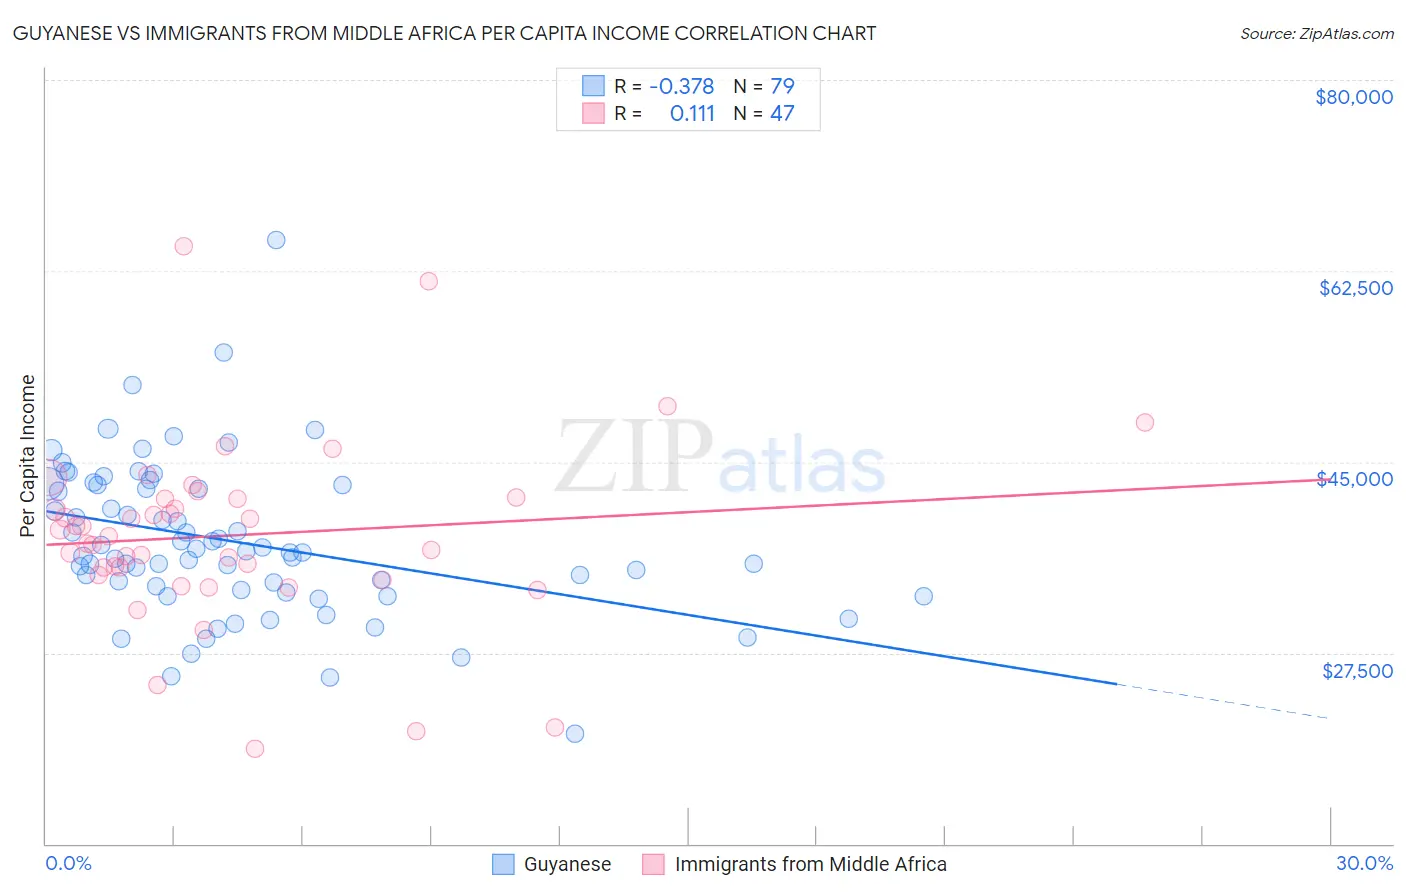
Guyanese vs Immigrants from Middle Africa Per Capita Income Correlation Chart
The statistical analysis conducted on geographies consisting of 176,945,802 people shows a mild negative correlation between the proportion of Guyanese and per capita income in the United States with a correlation coefficient (R) of -0.378 and weighted average of $40,949. Similarly, the statistical analysis conducted on geographies consisting of 202,748,114 people shows a poor positive correlation between the proportion of Immigrants from Middle Africa and per capita income in the United States with a correlation coefficient (R) of 0.111 and weighted average of $39,529, a difference of 3.6%.
Per Capita Income Correlation Summary
| Measurement | Guyanese | Immigrants from Middle Africa |
| Minimum | $20,131 | $18,741 |
| Maximum | $65,314 | $64,792 |
| Range | $45,183 | $46,051 |
| Mean | $37,694 | $38,268 |
| Median | $36,719 | $38,152 |
| Interquartile 25% (IQ1) | $33,285 | $34,623 |
| Interquartile 75% (IQ3) | $42,829 | $41,622 |
| Interquartile Range (IQR) | $9,544 | $6,999 |
| Standard Deviation (Sample) | $7,132 | $8,450 |
| Standard Deviation (Population) | $7,087 | $8,360 |
Similar Demographics by Per Capita Income
Demographics Similar to Guyanese by Per Capita Income
In terms of per capita income, the demographic groups most similar to Guyanese are Senegalese ($41,000, a difference of 0.12%), Native Hawaiian ($41,017, a difference of 0.16%), Nigerian ($41,026, a difference of 0.19%), Immigrants from Grenada ($41,123, a difference of 0.42%), and Delaware ($40,778, a difference of 0.42%).
| Demographics | Rating | Rank | Per Capita Income |
| West Indians | 6.0 /100 | #225 | Tragic $41,217 |
| Immigrants | Ecuador | 5.9 /100 | #226 | Tragic $41,195 |
| Immigrants | Ghana | 5.5 /100 | #227 | Tragic $41,131 |
| Immigrants | Grenada | 5.5 /100 | #228 | Tragic $41,123 |
| Nigerians | 4.9 /100 | #229 | Tragic $41,026 |
| Native Hawaiians | 4.9 /100 | #230 | Tragic $41,017 |
| Senegalese | 4.8 /100 | #231 | Tragic $41,000 |
| Guyanese | 4.5 /100 | #232 | Tragic $40,949 |
| Delaware | 3.8 /100 | #233 | Tragic $40,778 |
| Immigrants | West Indies | 3.7 /100 | #234 | Tragic $40,763 |
| Immigrants | Guyana | 3.6 /100 | #235 | Tragic $40,742 |
| Immigrants | Nonimmigrants | 3.4 /100 | #236 | Tragic $40,669 |
| Immigrants | Cambodia | 2.6 /100 | #237 | Tragic $40,434 |
| Somalis | 2.4 /100 | #238 | Tragic $40,367 |
| Tsimshian | 2.4 /100 | #239 | Tragic $40,344 |
Demographics Similar to Immigrants from Middle Africa by Per Capita Income
In terms of per capita income, the demographic groups most similar to Immigrants from Middle Africa are Alaska Native ($39,558, a difference of 0.070%), Osage ($39,568, a difference of 0.10%), Immigrants from the Azores ($39,608, a difference of 0.20%), Hawaiian ($39,403, a difference of 0.32%), and Nicaraguan ($39,372, a difference of 0.40%).
| Demographics | Rating | Rank | Per Capita Income |
| Cape Verdeans | 1.5 /100 | #248 | Tragic $39,935 |
| Japanese | 1.4 /100 | #249 | Tragic $39,870 |
| Immigrants | Burma/Myanmar | 1.3 /100 | #250 | Tragic $39,827 |
| Samoans | 1.3 /100 | #251 | Tragic $39,826 |
| Immigrants | Azores | 1.0 /100 | #252 | Tragic $39,608 |
| Osage | 1.0 /100 | #253 | Tragic $39,568 |
| Alaska Natives | 1.0 /100 | #254 | Tragic $39,558 |
| Immigrants | Middle Africa | 1.0 /100 | #255 | Tragic $39,529 |
| Hawaiians | 0.8 /100 | #256 | Tragic $39,403 |
| Nicaraguans | 0.8 /100 | #257 | Tragic $39,372 |
| Jamaicans | 0.7 /100 | #258 | Tragic $39,231 |
| Malaysians | 0.7 /100 | #259 | Tragic $39,194 |
| Alaskan Athabascans | 0.6 /100 | #260 | Tragic $39,163 |
| Marshallese | 0.6 /100 | #261 | Tragic $39,108 |
| Iroquois | 0.6 /100 | #262 | Tragic $39,104 |