Eastern European vs Immigrants from France Per Capita Income
COMPARE
Eastern European
Immigrants from France
Per Capita Income
Per Capita Income Comparison
Eastern Europeans
Immigrants from France
$55,780
PER CAPITA INCOME
100.0/ 100
METRIC RATING
11th/ 347
METRIC RANK
$54,557
PER CAPITA INCOME
100.0/ 100
METRIC RATING
17th/ 347
METRIC RANK
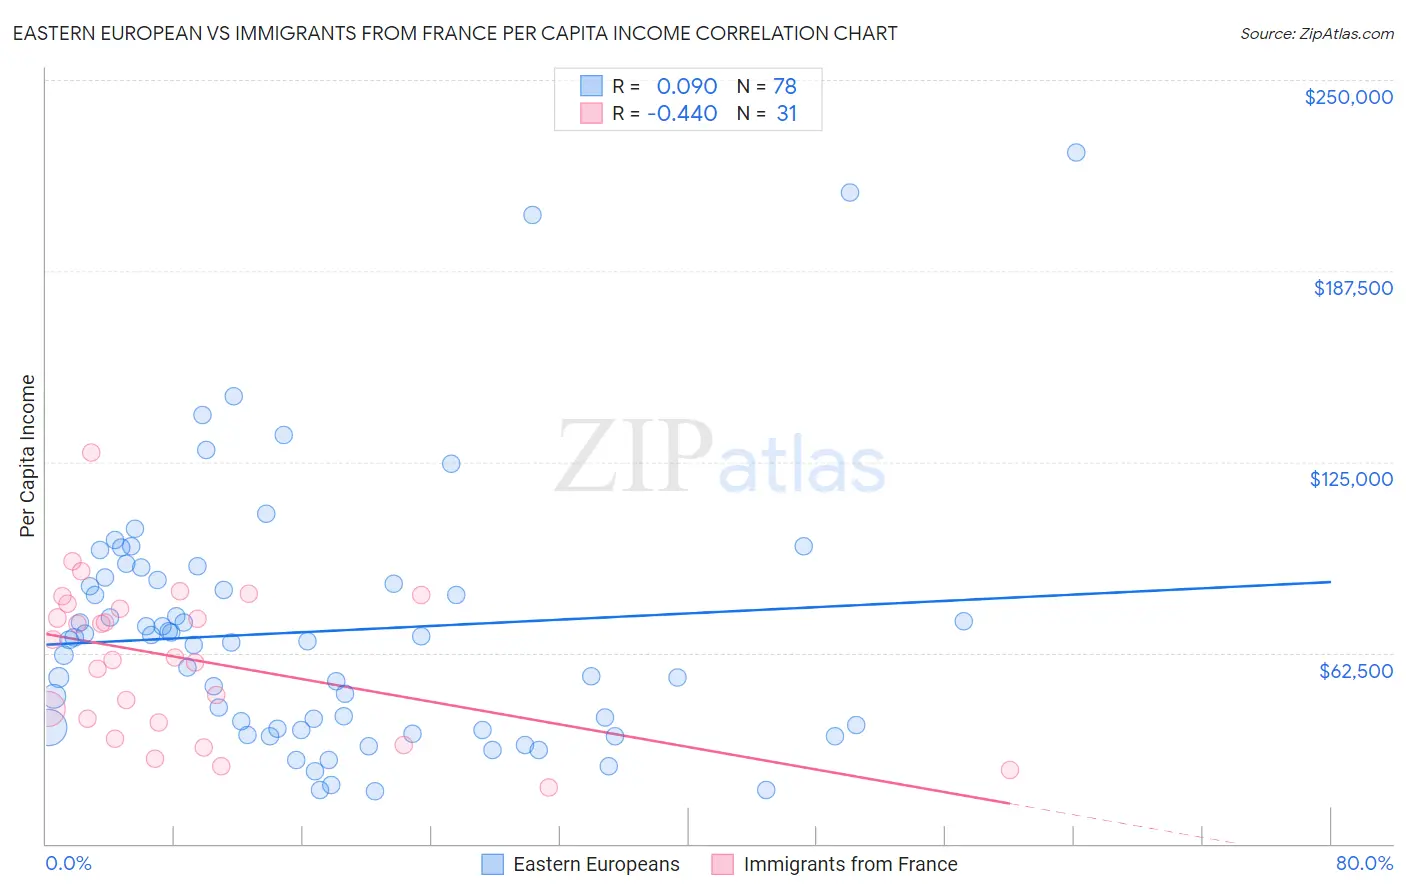
Eastern European vs Immigrants from France Per Capita Income Correlation Chart
The statistical analysis conducted on geographies consisting of 461,273,443 people shows a slight positive correlation between the proportion of Eastern Europeans and per capita income in the United States with a correlation coefficient (R) of 0.090 and weighted average of $55,780. Similarly, the statistical analysis conducted on geographies consisting of 287,921,754 people shows a moderate negative correlation between the proportion of Immigrants from France and per capita income in the United States with a correlation coefficient (R) of -0.440 and weighted average of $54,557, a difference of 2.2%.
Per Capita Income Correlation Summary
| Measurement | Eastern European | Immigrants from France |
| Minimum | $17,105 | $18,269 |
| Maximum | $226,072 | $128,207 |
| Range | $208,967 | $109,938 |
| Mean | $69,550 | $60,537 |
| Median | $66,546 | $61,063 |
| Interquartile 25% (IQ1) | $37,574 | $39,770 |
| Interquartile 75% (IQ3) | $86,383 | $78,483 |
| Interquartile Range (IQR) | $48,809 | $38,713 |
| Standard Deviation (Sample) | $42,028 | $25,024 |
| Standard Deviation (Population) | $41,758 | $24,617 |
Demographics Similar to Eastern Europeans and Immigrants from France by Per Capita Income
In terms of per capita income, the demographic groups most similar to Eastern Europeans are Okinawan ($55,817, a difference of 0.070%), Immigrants from Sweden ($55,582, a difference of 0.36%), Immigrants from India ($55,268, a difference of 0.93%), Immigrants from Belgium ($55,082, a difference of 1.3%), and Immigrants from Ireland ($56,584, a difference of 1.4%). Similarly, the demographic groups most similar to Immigrants from France are Thai ($54,307, a difference of 0.46%), Immigrants from China ($54,264, a difference of 0.54%), Immigrants from Switzerland ($54,866, a difference of 0.57%), Cypriot ($54,899, a difference of 0.63%), and Soviet Union ($54,202, a difference of 0.65%).
| Demographics | Rating | Rank | Per Capita Income |
| Immigrants | Australia | 100.0 /100 | #4 | Exceptional $57,953 |
| Immigrants | Iran | 100.0 /100 | #5 | Exceptional $57,759 |
| Immigrants | Taiwan | 100.0 /100 | #6 | Exceptional $57,742 |
| Immigrants | Israel | 100.0 /100 | #7 | Exceptional $57,384 |
| Immigrants | Hong Kong | 100.0 /100 | #8 | Exceptional $56,709 |
| Immigrants | Ireland | 100.0 /100 | #9 | Exceptional $56,584 |
| Okinawans | 100.0 /100 | #10 | Exceptional $55,817 |
| Eastern Europeans | 100.0 /100 | #11 | Exceptional $55,780 |
| Immigrants | Sweden | 100.0 /100 | #12 | Exceptional $55,582 |
| Immigrants | India | 100.0 /100 | #13 | Exceptional $55,268 |
| Immigrants | Belgium | 100.0 /100 | #14 | Exceptional $55,082 |
| Cypriots | 100.0 /100 | #15 | Exceptional $54,899 |
| Immigrants | Switzerland | 100.0 /100 | #16 | Exceptional $54,866 |
| Immigrants | France | 100.0 /100 | #17 | Exceptional $54,557 |
| Thais | 100.0 /100 | #18 | Exceptional $54,307 |
| Immigrants | China | 100.0 /100 | #19 | Exceptional $54,264 |
| Soviet Union | 100.0 /100 | #20 | Exceptional $54,202 |
| Immigrants | Northern Europe | 100.0 /100 | #21 | Exceptional $54,159 |
| Indians (Asian) | 100.0 /100 | #22 | Exceptional $53,874 |
| Immigrants | Eastern Asia | 100.0 /100 | #23 | Exceptional $53,806 |
| Immigrants | Denmark | 100.0 /100 | #24 | Exceptional $53,799 |