Pakistani vs Immigrants from France Per Capita Income
COMPARE
Pakistani
Immigrants from France
Per Capita Income
Per Capita Income Comparison
Pakistanis
Immigrants from France
$45,587
PER CAPITA INCOME
89.7/ 100
METRIC RATING
133rd/ 347
METRIC RANK
$54,557
PER CAPITA INCOME
100.0/ 100
METRIC RATING
17th/ 347
METRIC RANK
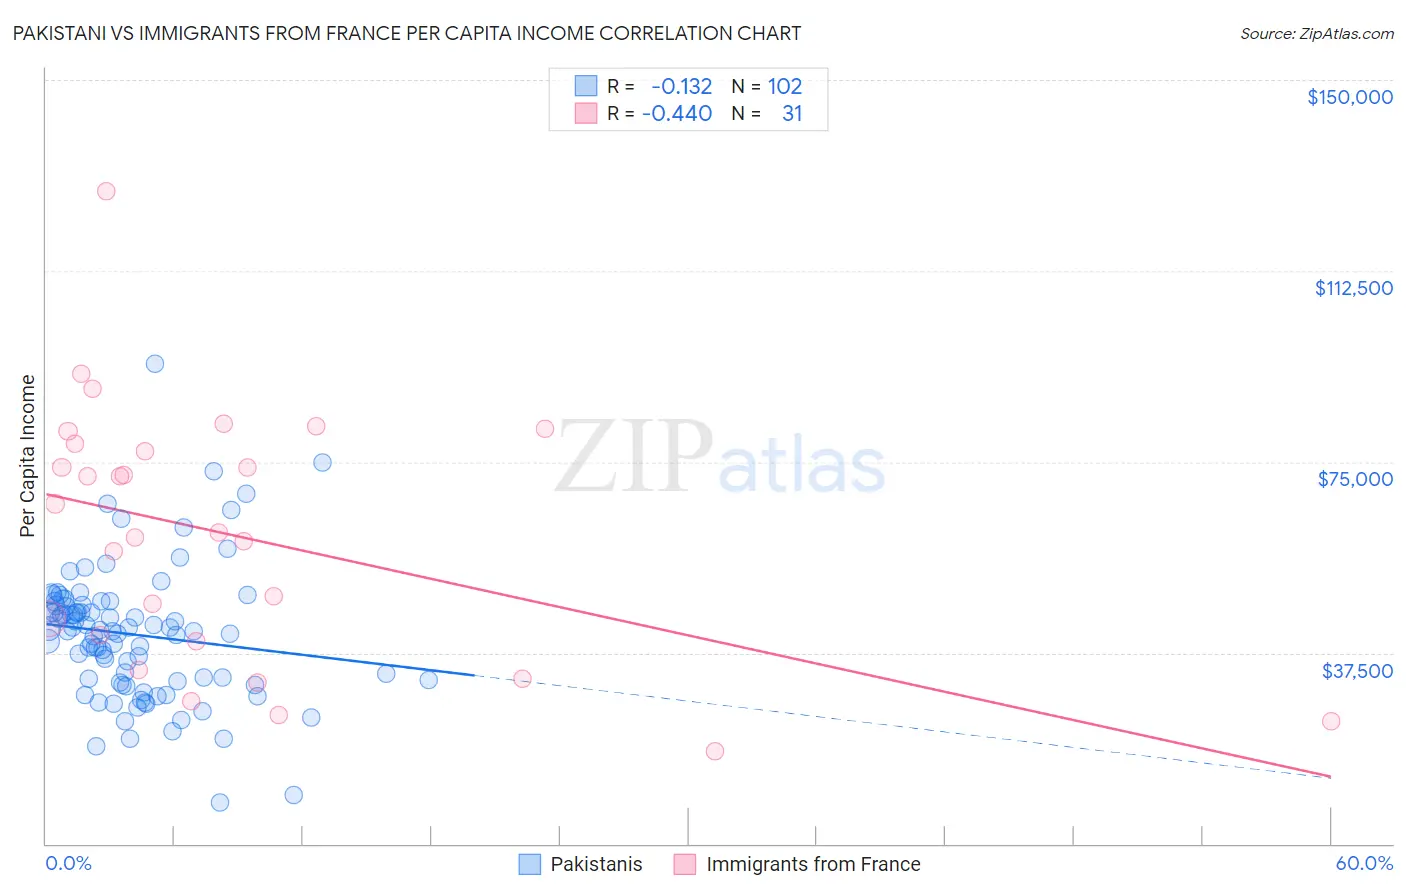
Pakistani vs Immigrants from France Per Capita Income Correlation Chart
The statistical analysis conducted on geographies consisting of 335,371,609 people shows a poor negative correlation between the proportion of Pakistanis and per capita income in the United States with a correlation coefficient (R) of -0.132 and weighted average of $45,587. Similarly, the statistical analysis conducted on geographies consisting of 287,921,754 people shows a moderate negative correlation between the proportion of Immigrants from France and per capita income in the United States with a correlation coefficient (R) of -0.440 and weighted average of $54,557, a difference of 19.7%.
Per Capita Income Correlation Summary
| Measurement | Pakistani | Immigrants from France |
| Minimum | $8,026 | $18,269 |
| Maximum | $94,275 | $128,207 |
| Range | $86,249 | $109,938 |
| Mean | $41,080 | $60,537 |
| Median | $41,744 | $61,063 |
| Interquartile 25% (IQ1) | $31,965 | $39,770 |
| Interquartile 75% (IQ3) | $46,855 | $78,483 |
| Interquartile Range (IQR) | $14,890 | $38,713 |
| Standard Deviation (Sample) | $13,251 | $25,024 |
| Standard Deviation (Population) | $13,186 | $24,617 |
Similar Demographics by Per Capita Income
Demographics Similar to Pakistanis by Per Capita Income
In terms of per capita income, the demographic groups most similar to Pakistanis are Slovene ($45,581, a difference of 0.010%), Jordanian ($45,605, a difference of 0.040%), Immigrants from North Macedonia ($45,622, a difference of 0.080%), Arab ($45,662, a difference of 0.16%), and Luxembourger ($45,663, a difference of 0.17%).
| Demographics | Rating | Rank | Per Capita Income |
| Palestinians | 91.6 /100 | #126 | Exceptional $45,790 |
| Immigrants | Germany | 91.3 /100 | #127 | Exceptional $45,751 |
| Swedes | 91.3 /100 | #128 | Exceptional $45,750 |
| Luxembourgers | 90.4 /100 | #129 | Exceptional $45,663 |
| Arabs | 90.4 /100 | #130 | Exceptional $45,662 |
| Immigrants | North Macedonia | 90.0 /100 | #131 | Exceptional $45,622 |
| Jordanians | 89.9 /100 | #132 | Excellent $45,605 |
| Pakistanis | 89.7 /100 | #133 | Excellent $45,587 |
| Slovenes | 89.6 /100 | #134 | Excellent $45,581 |
| Hungarians | 87.9 /100 | #135 | Excellent $45,426 |
| Immigrants | Oceania | 85.2 /100 | #136 | Excellent $45,220 |
| Immigrants | Syria | 85.2 /100 | #137 | Excellent $45,218 |
| Assyrians/Chaldeans/Syriacs | 84.8 /100 | #138 | Excellent $45,195 |
| Basques | 83.2 /100 | #139 | Excellent $45,086 |
| Immigrants | Jordan | 82.9 /100 | #140 | Excellent $45,066 |
Demographics Similar to Immigrants from France by Per Capita Income
In terms of per capita income, the demographic groups most similar to Immigrants from France are Thai ($54,307, a difference of 0.46%), Immigrants from China ($54,264, a difference of 0.54%), Immigrants from Switzerland ($54,866, a difference of 0.57%), Cypriot ($54,899, a difference of 0.63%), and Soviet Union ($54,202, a difference of 0.65%).
| Demographics | Rating | Rank | Per Capita Income |
| Okinawans | 100.0 /100 | #10 | Exceptional $55,817 |
| Eastern Europeans | 100.0 /100 | #11 | Exceptional $55,780 |
| Immigrants | Sweden | 100.0 /100 | #12 | Exceptional $55,582 |
| Immigrants | India | 100.0 /100 | #13 | Exceptional $55,268 |
| Immigrants | Belgium | 100.0 /100 | #14 | Exceptional $55,082 |
| Cypriots | 100.0 /100 | #15 | Exceptional $54,899 |
| Immigrants | Switzerland | 100.0 /100 | #16 | Exceptional $54,866 |
| Immigrants | France | 100.0 /100 | #17 | Exceptional $54,557 |
| Thais | 100.0 /100 | #18 | Exceptional $54,307 |
| Immigrants | China | 100.0 /100 | #19 | Exceptional $54,264 |
| Soviet Union | 100.0 /100 | #20 | Exceptional $54,202 |
| Immigrants | Northern Europe | 100.0 /100 | #21 | Exceptional $54,159 |
| Indians (Asian) | 100.0 /100 | #22 | Exceptional $53,874 |
| Immigrants | Eastern Asia | 100.0 /100 | #23 | Exceptional $53,806 |
| Immigrants | Denmark | 100.0 /100 | #24 | Exceptional $53,799 |