Aleut vs Immigrants from Venezuela Median Male Earnings
COMPARE
Aleut
Immigrants from Venezuela
Median Male Earnings
Median Male Earnings Comparison
Aleuts
Immigrants from Venezuela
$51,168
MEDIAN MALE EARNINGS
3.7/ 100
METRIC RATING
233rd/ 347
METRIC RANK
$52,041
MEDIAN MALE EARNINGS
8.3/ 100
METRIC RATING
216th/ 347
METRIC RANK
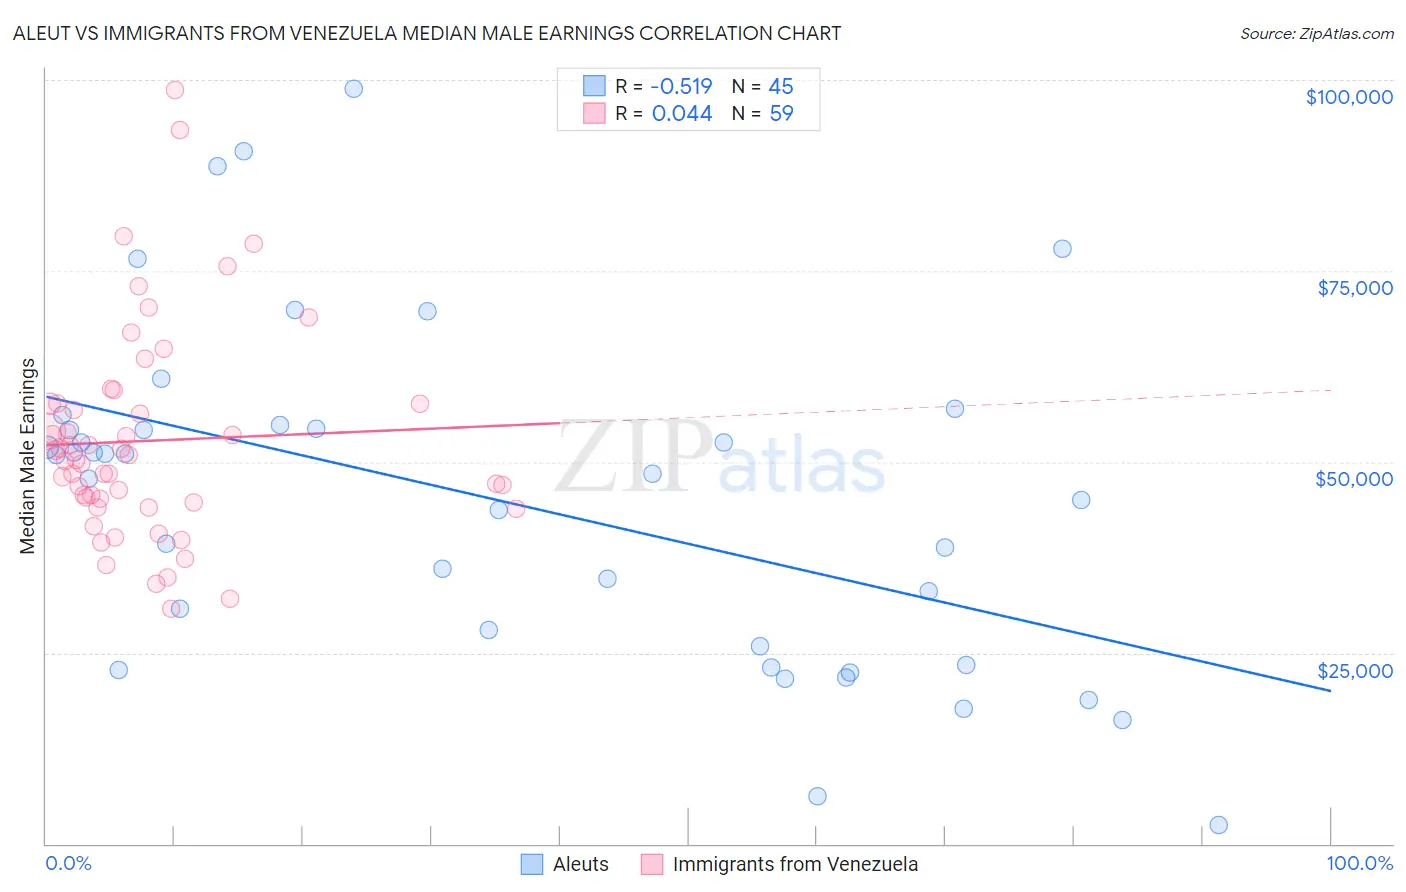
Aleut vs Immigrants from Venezuela Median Male Earnings Correlation Chart
The statistical analysis conducted on geographies consisting of 61,765,699 people shows a substantial negative correlation between the proportion of Aleuts and median male earnings in the United States with a correlation coefficient (R) of -0.519 and weighted average of $51,168. Similarly, the statistical analysis conducted on geographies consisting of 287,825,740 people shows no correlation between the proportion of Immigrants from Venezuela and median male earnings in the United States with a correlation coefficient (R) of 0.044 and weighted average of $52,041, a difference of 1.7%.
Median Male Earnings Correlation Summary
| Measurement | Aleut | Immigrants from Venezuela |
| Minimum | $2,499 | $30,787 |
| Maximum | $98,906 | $98,656 |
| Range | $96,407 | $67,869 |
| Mean | $44,984 | $52,768 |
| Median | $48,500 | $50,259 |
| Interquartile 25% (IQ1) | $24,583 | $44,609 |
| Interquartile 75% (IQ3) | $54,582 | $57,648 |
| Interquartile Range (IQR) | $29,999 | $13,039 |
| Standard Deviation (Sample) | $22,008 | $13,735 |
| Standard Deviation (Population) | $21,762 | $13,618 |
Demographics Similar to Aleuts and Immigrants from Venezuela by Median Male Earnings
In terms of median male earnings, the demographic groups most similar to Aleuts are Sudanese ($51,216, a difference of 0.090%), Barbadian ($51,236, a difference of 0.13%), Cape Verdean ($51,103, a difference of 0.13%), Immigrants from Nigeria ($51,310, a difference of 0.28%), and Immigrants from Trinidad and Tobago ($51,376, a difference of 0.41%). Similarly, the demographic groups most similar to Immigrants from Venezuela are Nigerian ($52,039, a difference of 0.0%), Immigrants from Cameroon ($52,119, a difference of 0.15%), Immigrants from Panama ($51,962, a difference of 0.15%), Nonimmigrants ($52,170, a difference of 0.25%), and Immigrants from Ghana ($51,836, a difference of 0.40%).
| Demographics | Rating | Rank | Median Male Earnings |
| Immigrants | Nonimmigrants | 9.3 /100 | #214 | Tragic $52,170 |
| Immigrants | Cameroon | 8.9 /100 | #215 | Tragic $52,119 |
| Immigrants | Venezuela | 8.3 /100 | #216 | Tragic $52,041 |
| Nigerians | 8.3 /100 | #217 | Tragic $52,039 |
| Immigrants | Panama | 7.7 /100 | #218 | Tragic $51,962 |
| Immigrants | Ghana | 6.9 /100 | #219 | Tragic $51,836 |
| Immigrants | Armenia | 6.6 /100 | #220 | Tragic $51,793 |
| Immigrants | Senegal | 5.8 /100 | #221 | Tragic $51,647 |
| Immigrants | Bangladesh | 5.8 /100 | #222 | Tragic $51,642 |
| Ecuadorians | 5.5 /100 | #223 | Tragic $51,596 |
| Immigrants | Cambodia | 5.5 /100 | #224 | Tragic $51,594 |
| Immigrants | Sudan | 5.0 /100 | #225 | Tragic $51,489 |
| Japanese | 4.9 /100 | #226 | Tragic $51,473 |
| Trinidadians and Tobagonians | 4.8 /100 | #227 | Tragic $51,446 |
| Samoans | 4.6 /100 | #228 | Tragic $51,389 |
| Immigrants | Trinidad and Tobago | 4.5 /100 | #229 | Tragic $51,376 |
| Immigrants | Nigeria | 4.2 /100 | #230 | Tragic $51,310 |
| Barbadians | 3.9 /100 | #231 | Tragic $51,236 |
| Sudanese | 3.9 /100 | #232 | Tragic $51,216 |
| Aleuts | 3.7 /100 | #233 | Tragic $51,168 |
| Cape Verdeans | 3.5 /100 | #234 | Tragic $51,103 |