Dutch vs Apache Householder Income Under 25 years
COMPARE
Dutch
Apache
Householder Income Under 25 years
Householder Income Under 25 years Comparison
Dutch
Apache
$51,265
HOUSEHOLDER INCOME UNDER 25 YEARS
9.4/ 100
METRIC RATING
213th/ 347
METRIC RANK
$49,395
HOUSEHOLDER INCOME UNDER 25 YEARS
0.1/ 100
METRIC RATING
279th/ 347
METRIC RANK
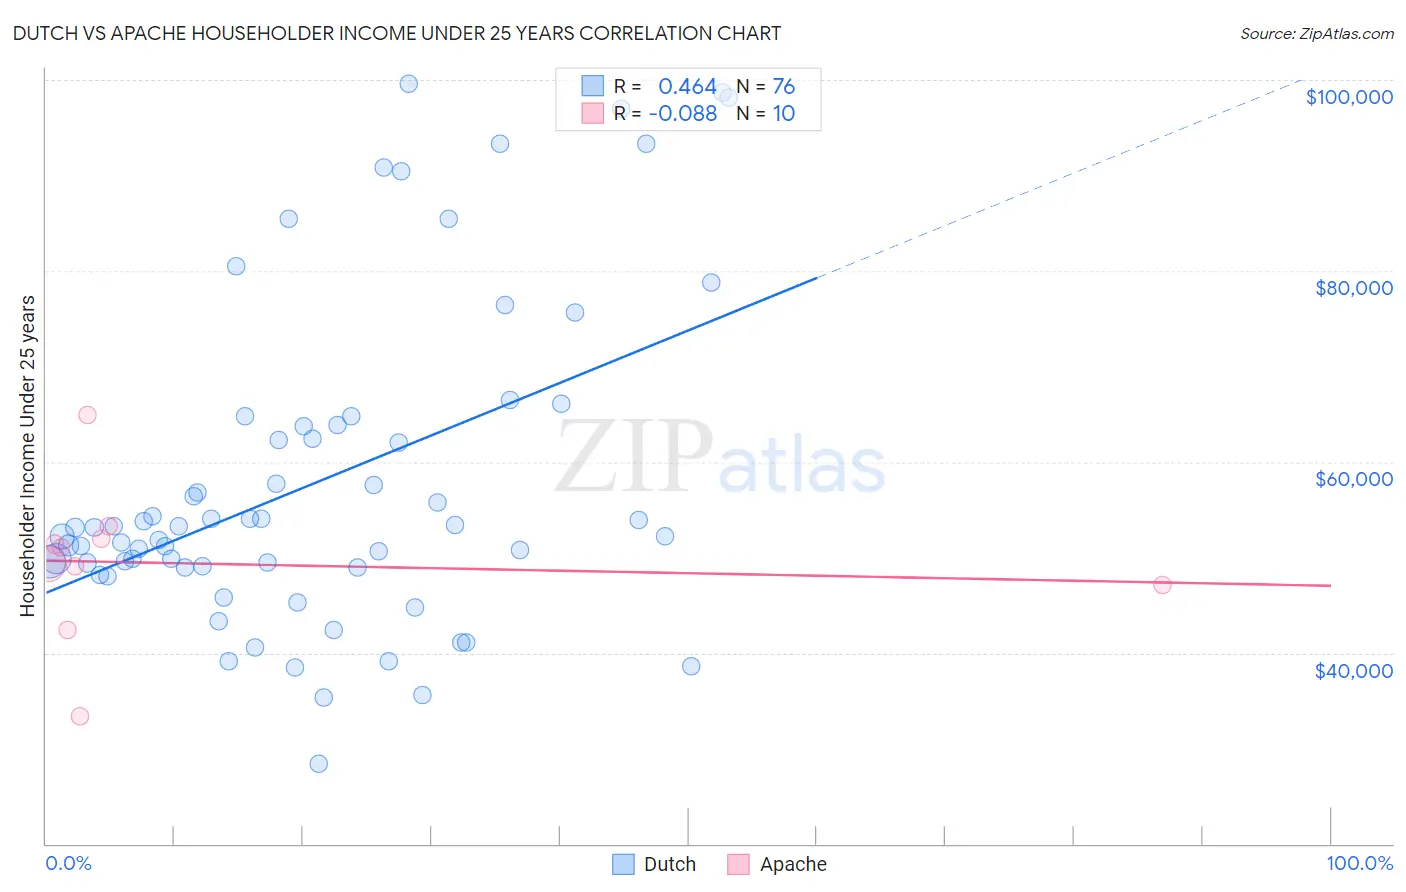
Dutch vs Apache Householder Income Under 25 years Correlation Chart
The statistical analysis conducted on geographies consisting of 431,004,830 people shows a moderate positive correlation between the proportion of Dutch and household income with householder under the age of 25 in the United States with a correlation coefficient (R) of 0.464 and weighted average of $51,265. Similarly, the statistical analysis conducted on geographies consisting of 208,884,010 people shows a slight negative correlation between the proportion of Apache and household income with householder under the age of 25 in the United States with a correlation coefficient (R) of -0.088 and weighted average of $49,395, a difference of 3.8%.
Householder Income Under 25 years Correlation Summary
| Measurement | Dutch | Apache |
| Minimum | $28,378 | $33,347 |
| Maximum | $99,620 | $64,911 |
| Range | $71,242 | $31,564 |
| Mean | $57,868 | $49,372 |
| Median | $53,119 | $50,154 |
| Interquartile 25% (IQ1) | $49,046 | $47,083 |
| Interquartile 75% (IQ3) | $63,833 | $51,895 |
| Interquartile Range (IQR) | $14,787 | $4,812 |
| Standard Deviation (Sample) | $16,885 | $8,028 |
| Standard Deviation (Population) | $16,773 | $7,616 |
Similar Demographics by Householder Income Under 25 years
Demographics Similar to Dutch by Householder Income Under 25 years
In terms of householder income under 25 years, the demographic groups most similar to Dutch are Zimbabwean ($51,259, a difference of 0.010%), Immigrants from Panama ($51,278, a difference of 0.030%), Icelander ($51,247, a difference of 0.030%), French ($51,230, a difference of 0.070%), and Czechoslovakian ($51,224, a difference of 0.080%).
| Demographics | Rating | Rank | Householder Income Under 25 years |
| Immigrants | Latin America | 12.3 /100 | #206 | Poor $51,387 |
| South Africans | 12.2 /100 | #207 | Poor $51,383 |
| Immigrants | Jordan | 11.9 /100 | #208 | Poor $51,370 |
| Syrians | 11.4 /100 | #209 | Poor $51,353 |
| Immigrants | Ghana | 10.9 /100 | #210 | Poor $51,333 |
| Irish | 10.6 /100 | #211 | Poor $51,317 |
| Immigrants | Panama | 9.7 /100 | #212 | Tragic $51,278 |
| Dutch | 9.4 /100 | #213 | Tragic $51,265 |
| Zimbabweans | 9.3 /100 | #214 | Tragic $51,259 |
| Icelanders | 9.1 /100 | #215 | Tragic $51,247 |
| French | 8.7 /100 | #216 | Tragic $51,230 |
| Czechoslovakians | 8.6 /100 | #217 | Tragic $51,224 |
| Immigrants | Belize | 8.6 /100 | #218 | Tragic $51,223 |
| Arabs | 8.5 /100 | #219 | Tragic $51,219 |
| Immigrants | Germany | 8.0 /100 | #220 | Tragic $51,190 |
Demographics Similar to Apache by Householder Income Under 25 years
In terms of householder income under 25 years, the demographic groups most similar to Apache are Nigerian ($49,416, a difference of 0.040%), Hmong ($49,364, a difference of 0.060%), Nonimmigrants ($49,348, a difference of 0.090%), Alsatian ($49,267, a difference of 0.26%), and Immigrants from Nigeria ($49,174, a difference of 0.45%).
| Demographics | Rating | Rank | Householder Income Under 25 years |
| Colville | 0.3 /100 | #272 | Tragic $49,774 |
| Slovaks | 0.3 /100 | #273 | Tragic $49,753 |
| Immigrants | Senegal | 0.3 /100 | #274 | Tragic $49,742 |
| Immigrants | Kenya | 0.2 /100 | #275 | Tragic $49,633 |
| Dominicans | 0.2 /100 | #276 | Tragic $49,633 |
| Immigrants | Western Africa | 0.2 /100 | #277 | Tragic $49,621 |
| Nigerians | 0.1 /100 | #278 | Tragic $49,416 |
| Apache | 0.1 /100 | #279 | Tragic $49,395 |
| Hmong | 0.1 /100 | #280 | Tragic $49,364 |
| Immigrants | Nonimmigrants | 0.1 /100 | #281 | Tragic $49,348 |
| Alsatians | 0.1 /100 | #282 | Tragic $49,267 |
| Immigrants | Nigeria | 0.1 /100 | #283 | Tragic $49,174 |
| Carpatho Rusyns | 0.1 /100 | #284 | Tragic $49,113 |
| Scotch-Irish | 0.0 /100 | #285 | Tragic $49,039 |
| French American Indians | 0.0 /100 | #286 | Tragic $48,977 |