Filipino vs Immigrants from Mexico Median Female Earnings
COMPARE
Filipino
Immigrants from Mexico
Median Female Earnings
Median Female Earnings Comparison
Filipinos
Immigrants from Mexico
$49,508
MEDIAN FEMALE EARNINGS
100.0/ 100
METRIC RATING
2nd/ 347
METRIC RANK
$33,236
MEDIAN FEMALE EARNINGS
0.0/ 100
METRIC RATING
339th/ 347
METRIC RANK
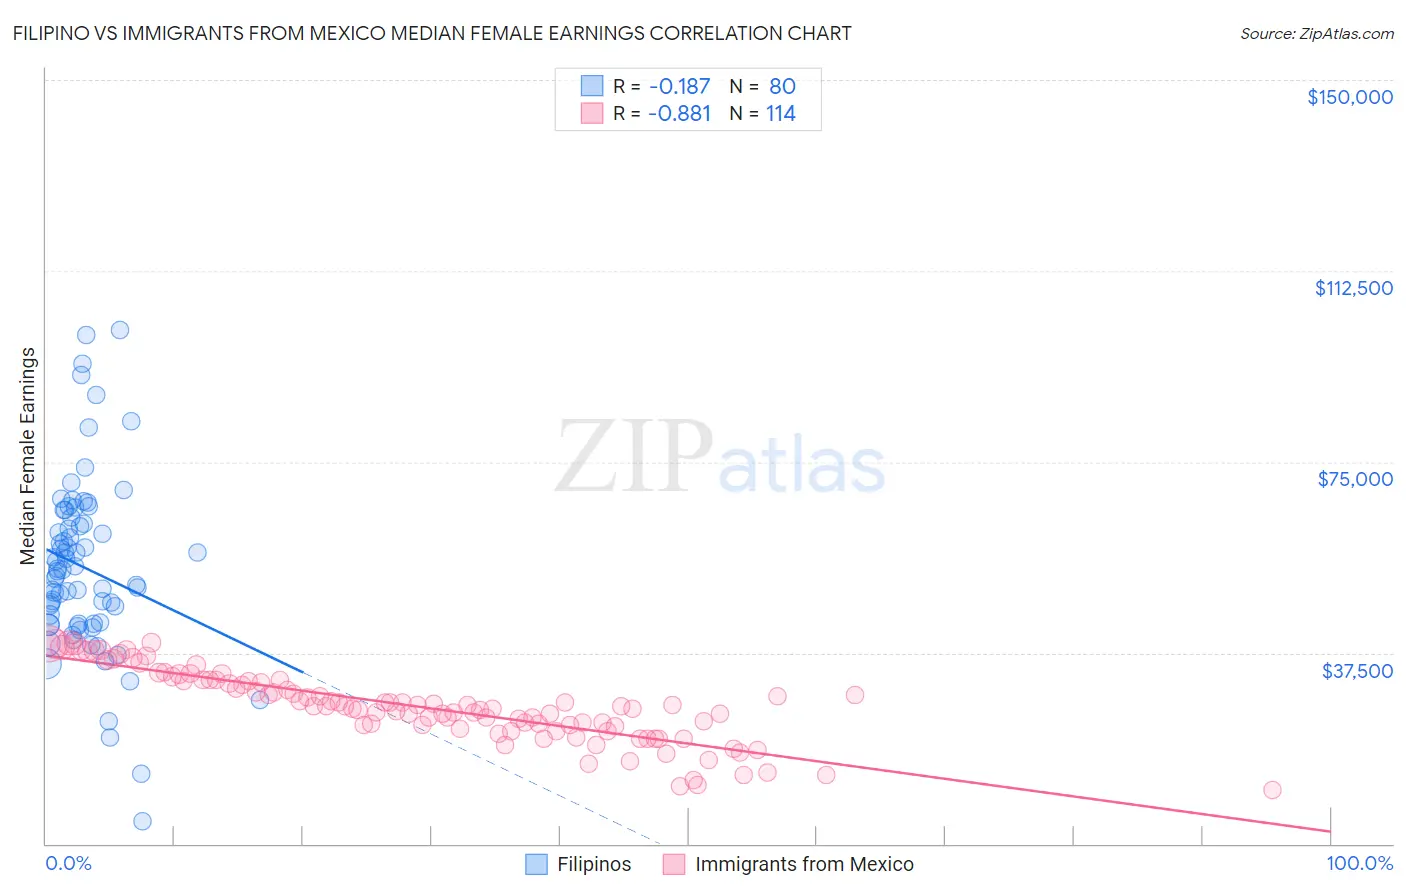
Filipino vs Immigrants from Mexico Median Female Earnings Correlation Chart
The statistical analysis conducted on geographies consisting of 254,323,298 people shows a poor negative correlation between the proportion of Filipinos and median female earnings in the United States with a correlation coefficient (R) of -0.187 and weighted average of $49,508. Similarly, the statistical analysis conducted on geographies consisting of 512,787,138 people shows a very strong negative correlation between the proportion of Immigrants from Mexico and median female earnings in the United States with a correlation coefficient (R) of -0.881 and weighted average of $33,236, a difference of 49.0%.
Median Female Earnings Correlation Summary
| Measurement | Filipino | Immigrants from Mexico |
| Minimum | $4,500 | $10,532 |
| Maximum | $100,821 | $39,508 |
| Range | $96,321 | $28,976 |
| Mean | $54,231 | $26,933 |
| Median | $53,668 | $26,949 |
| Interquartile 25% (IQ1) | $43,160 | $22,999 |
| Interquartile 75% (IQ3) | $63,449 | $32,002 |
| Interquartile Range (IQR) | $20,289 | $9,003 |
| Standard Deviation (Sample) | $17,351 | $6,963 |
| Standard Deviation (Population) | $17,242 | $6,932 |
Similar Demographics by Median Female Earnings
Demographics Similar to Filipinos by Median Female Earnings
In terms of median female earnings, the demographic groups most similar to Filipinos are Immigrants from Taiwan ($49,256, a difference of 0.51%), Immigrants from Hong Kong ($49,818, a difference of 0.63%), Immigrants from India ($48,292, a difference of 2.5%), Immigrants from Singapore ($47,986, a difference of 3.2%), and Immigrants from Ireland ($47,598, a difference of 4.0%).
| Demographics | Rating | Rank | Median Female Earnings |
| Immigrants | Hong Kong | 100.0 /100 | #1 | Exceptional $49,818 |
| Filipinos | 100.0 /100 | #2 | Exceptional $49,508 |
| Immigrants | Taiwan | 100.0 /100 | #3 | Exceptional $49,256 |
| Immigrants | India | 100.0 /100 | #4 | Exceptional $48,292 |
| Immigrants | Singapore | 100.0 /100 | #5 | Exceptional $47,986 |
| Immigrants | Ireland | 100.0 /100 | #6 | Exceptional $47,598 |
| Thais | 100.0 /100 | #7 | Exceptional $47,577 |
| Iranians | 100.0 /100 | #8 | Exceptional $47,421 |
| Immigrants | Iran | 100.0 /100 | #9 | Exceptional $47,154 |
| Immigrants | China | 100.0 /100 | #10 | Exceptional $46,972 |
| Okinawans | 100.0 /100 | #11 | Exceptional $46,905 |
| Immigrants | Israel | 100.0 /100 | #12 | Exceptional $46,902 |
| Immigrants | Australia | 100.0 /100 | #13 | Exceptional $46,573 |
| Soviet Union | 100.0 /100 | #14 | Exceptional $46,556 |
| Immigrants | Eastern Asia | 100.0 /100 | #15 | Exceptional $46,502 |
Demographics Similar to Immigrants from Mexico by Median Female Earnings
In terms of median female earnings, the demographic groups most similar to Immigrants from Mexico are Tohono O'odham ($33,205, a difference of 0.090%), Immigrants from Cuba ($33,291, a difference of 0.17%), Yakama ($33,354, a difference of 0.36%), Ottawa ($33,378, a difference of 0.43%), and Navajo ($33,046, a difference of 0.57%).
| Demographics | Rating | Rank | Median Female Earnings |
| Choctaw | 0.0 /100 | #332 | Tragic $33,775 |
| Mexicans | 0.0 /100 | #333 | Tragic $33,664 |
| Spanish American Indians | 0.0 /100 | #334 | Tragic $33,625 |
| Creek | 0.0 /100 | #335 | Tragic $33,437 |
| Ottawa | 0.0 /100 | #336 | Tragic $33,378 |
| Yakama | 0.0 /100 | #337 | Tragic $33,354 |
| Immigrants | Cuba | 0.0 /100 | #338 | Tragic $33,291 |
| Immigrants | Mexico | 0.0 /100 | #339 | Tragic $33,236 |
| Tohono O'odham | 0.0 /100 | #340 | Tragic $33,205 |
| Navajo | 0.0 /100 | #341 | Tragic $33,046 |
| Yup'ik | 0.0 /100 | #342 | Tragic $32,730 |
| Pueblo | 0.0 /100 | #343 | Tragic $32,564 |
| Lumbee | 0.0 /100 | #344 | Tragic $32,500 |
| Puerto Ricans | 0.0 /100 | #345 | Tragic $31,560 |
| Arapaho | 0.0 /100 | #346 | Tragic $31,489 |