Ghanaian vs Immigrants from Mexico Female Disability
COMPARE
Ghanaian
Immigrants from Mexico
Female Disability
Female Disability Comparison
Ghanaians
Immigrants from Mexico
12.1%
FEMALE DISABILITY
76.6/ 100
METRIC RATING
155th/ 347
METRIC RANK
12.2%
FEMALE DISABILITY
50.8/ 100
METRIC RATING
173rd/ 347
METRIC RANK
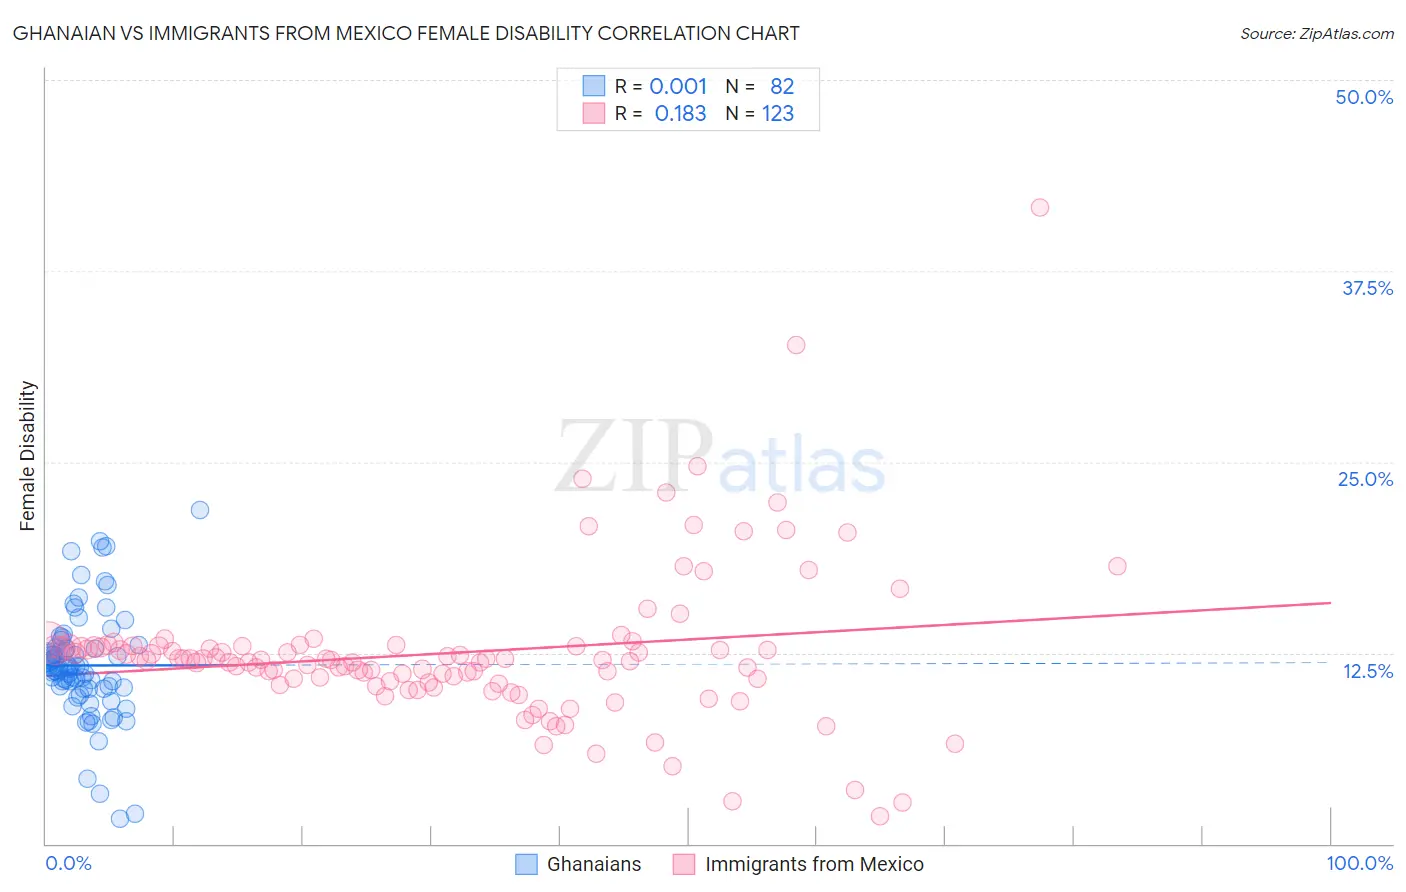
Ghanaian vs Immigrants from Mexico Female Disability Correlation Chart
The statistical analysis conducted on geographies consisting of 190,696,570 people shows no correlation between the proportion of Ghanaians and percentage of females with a disability in the United States with a correlation coefficient (R) of 0.001 and weighted average of 12.1%. Similarly, the statistical analysis conducted on geographies consisting of 513,519,603 people shows a poor positive correlation between the proportion of Immigrants from Mexico and percentage of females with a disability in the United States with a correlation coefficient (R) of 0.183 and weighted average of 12.2%, a difference of 1.1%.
Female Disability Correlation Summary
| Measurement | Ghanaian | Immigrants from Mexico |
| Minimum | 1.6% | 1.8% |
| Maximum | 21.9% | 41.7% |
| Range | 20.2% | 39.9% |
| Mean | 11.7% | 12.5% |
| Median | 11.5% | 12.1% |
| Interquartile 25% (IQ1) | 10.2% | 10.6% |
| Interquartile 75% (IQ3) | 12.9% | 12.9% |
| Interquartile Range (IQR) | 2.7% | 2.4% |
| Standard Deviation (Sample) | 3.6% | 5.0% |
| Standard Deviation (Population) | 3.6% | 5.0% |
Demographics Similar to Ghanaians and Immigrants from Mexico by Female Disability
In terms of female disability, the demographic groups most similar to Ghanaians are Syrian (12.1%, a difference of 0.020%), Moroccan (12.1%, a difference of 0.19%), Danish (12.1%, a difference of 0.20%), Immigrants from Middle Africa (12.1%, a difference of 0.21%), and Immigrants from Central America (12.1%, a difference of 0.42%). Similarly, the demographic groups most similar to Immigrants from Mexico are Immigrants from England (12.2%, a difference of 0.030%), Haitian (12.2%, a difference of 0.040%), Immigrants from Southern Europe (12.2%, a difference of 0.21%), Maltese (12.2%, a difference of 0.23%), and Lebanese (12.2%, a difference of 0.28%).
| Demographics | Rating | Rank | Female Disability |
| Syrians | 76.9 /100 | #154 | Good 12.1% |
| Ghanaians | 76.6 /100 | #155 | Good 12.1% |
| Moroccans | 72.9 /100 | #156 | Good 12.1% |
| Danes | 72.5 /100 | #157 | Good 12.1% |
| Immigrants | Middle Africa | 72.4 /100 | #158 | Good 12.1% |
| Immigrants | Central America | 67.7 /100 | #159 | Good 12.1% |
| Immigrants | Guatemala | 66.0 /100 | #160 | Good 12.1% |
| Guyanese | 64.7 /100 | #161 | Good 12.1% |
| Immigrants | Ukraine | 64.3 /100 | #162 | Good 12.1% |
| Guatemalans | 63.8 /100 | #163 | Good 12.1% |
| Czechs | 63.6 /100 | #164 | Good 12.1% |
| Immigrants | Oceania | 61.8 /100 | #165 | Good 12.1% |
| Lithuanians | 59.5 /100 | #166 | Average 12.2% |
| Immigrants | Latin America | 59.0 /100 | #167 | Average 12.2% |
| Immigrants | Haiti | 58.8 /100 | #168 | Average 12.2% |
| Lebanese | 58.1 /100 | #169 | Average 12.2% |
| Maltese | 57.0 /100 | #170 | Average 12.2% |
| Immigrants | Southern Europe | 56.3 /100 | #171 | Average 12.2% |
| Haitians | 51.9 /100 | #172 | Average 12.2% |
| Immigrants | Mexico | 50.8 /100 | #173 | Average 12.2% |
| Immigrants | England | 50.0 /100 | #174 | Average 12.2% |