Jamaican vs Guatemalan Median Household Income
COMPARE
Jamaican
Guatemalan
Median Household Income
Median Household Income Comparison
Jamaicans
Guatemalans
$76,583
MEDIAN HOUSEHOLD INCOME
0.4/ 100
METRIC RATING
260th/ 347
METRIC RANK
$75,961
MEDIAN HOUSEHOLD INCOME
0.3/ 100
METRIC RATING
264th/ 347
METRIC RANK
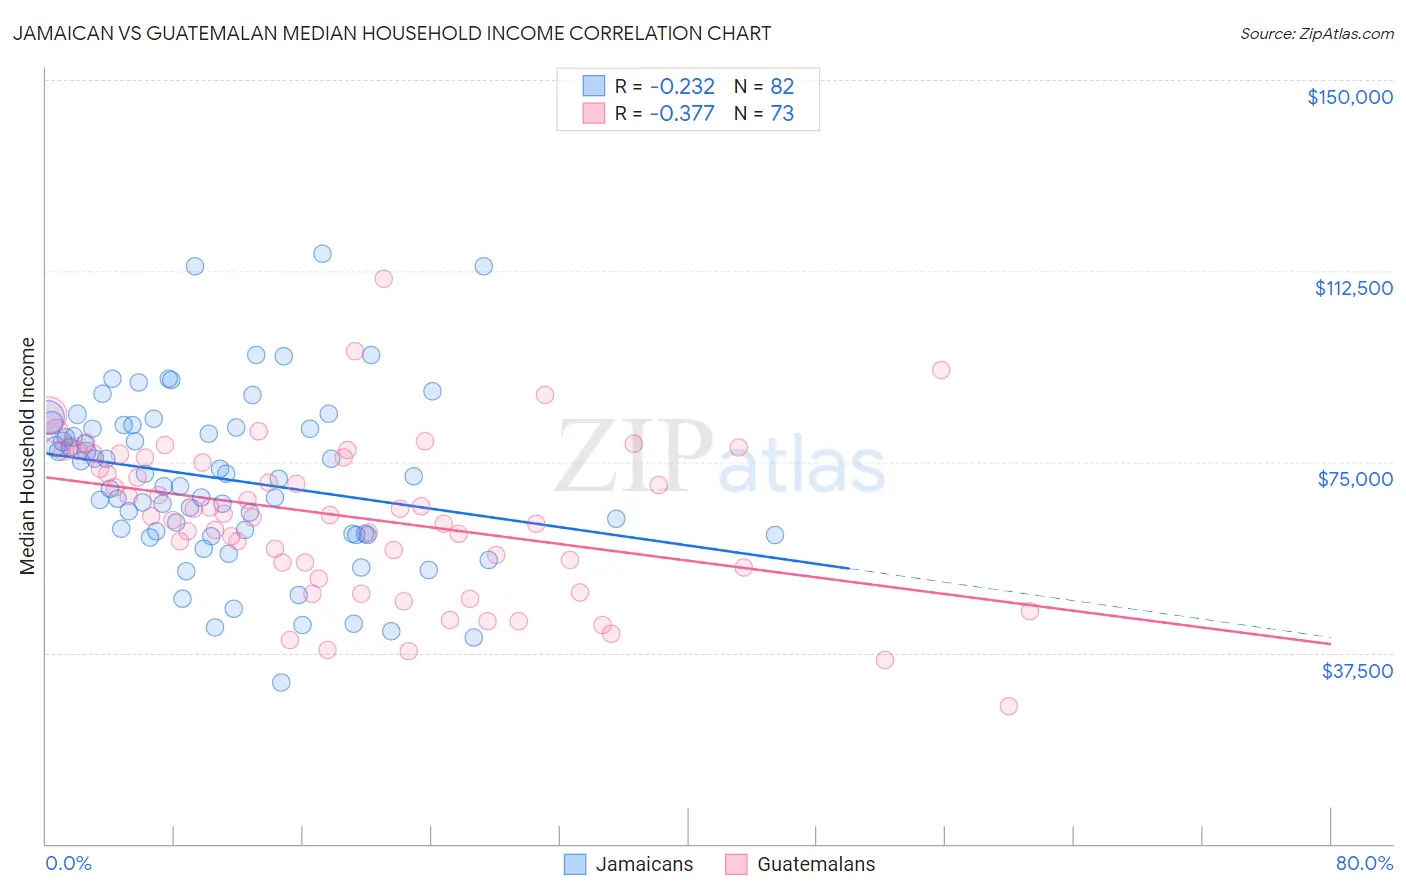
Jamaican vs Guatemalan Median Household Income Correlation Chart
The statistical analysis conducted on geographies consisting of 367,555,449 people shows a weak negative correlation between the proportion of Jamaicans and median household income in the United States with a correlation coefficient (R) of -0.232 and weighted average of $76,583. Similarly, the statistical analysis conducted on geographies consisting of 409,198,651 people shows a mild negative correlation between the proportion of Guatemalans and median household income in the United States with a correlation coefficient (R) of -0.377 and weighted average of $75,961, a difference of 0.82%.
Median Household Income Correlation Summary
| Measurement | Jamaican | Guatemalan |
| Minimum | $31,580 | $26,979 |
| Maximum | $115,872 | $111,004 |
| Range | $84,292 | $84,025 |
| Mean | $71,605 | $64,179 |
| Median | $71,865 | $64,652 |
| Interquartile 25% (IQ1) | $60,801 | $54,709 |
| Interquartile 75% (IQ3) | $81,812 | $76,221 |
| Interquartile Range (IQR) | $21,011 | $21,512 |
| Standard Deviation (Sample) | $16,569 | $15,411 |
| Standard Deviation (Population) | $16,468 | $15,305 |
Demographics Similar to Jamaicans and Guatemalans by Median Household Income
In terms of median household income, the demographic groups most similar to Jamaicans are Immigrants from Grenada ($76,517, a difference of 0.090%), Spanish American Indian ($76,670, a difference of 0.11%), Immigrants from Nicaragua ($76,784, a difference of 0.26%), French American Indian ($76,387, a difference of 0.26%), and Alaskan Athabascan ($76,383, a difference of 0.26%). Similarly, the demographic groups most similar to Guatemalans are Immigrants from Belize ($75,938, a difference of 0.030%), American ($75,932, a difference of 0.040%), German Russian ($75,856, a difference of 0.14%), Immigrants from Jamaica ($75,851, a difference of 0.15%), and Cape Verdean ($75,848, a difference of 0.15%).
| Demographics | Rating | Rank | Median Household Income |
| Immigrants | West Indies | 1.0 /100 | #252 | Tragic $77,956 |
| Immigrants | St. Vincent and the Grenadines | 0.9 /100 | #253 | Tragic $77,690 |
| Sub-Saharan Africans | 0.8 /100 | #254 | Tragic $77,631 |
| Immigrants | Middle Africa | 0.8 /100 | #255 | Tragic $77,559 |
| Belizeans | 0.6 /100 | #256 | Tragic $77,028 |
| Immigrants | Senegal | 0.5 /100 | #257 | Tragic $76,915 |
| Immigrants | Nicaragua | 0.5 /100 | #258 | Tragic $76,784 |
| Spanish American Indians | 0.4 /100 | #259 | Tragic $76,670 |
| Jamaicans | 0.4 /100 | #260 | Tragic $76,583 |
| Immigrants | Grenada | 0.4 /100 | #261 | Tragic $76,517 |
| French American Indians | 0.4 /100 | #262 | Tragic $76,387 |
| Alaskan Athabascans | 0.4 /100 | #263 | Tragic $76,383 |
| Guatemalans | 0.3 /100 | #264 | Tragic $75,961 |
| Immigrants | Belize | 0.3 /100 | #265 | Tragic $75,938 |
| Americans | 0.3 /100 | #266 | Tragic $75,932 |
| German Russians | 0.3 /100 | #267 | Tragic $75,856 |
| Immigrants | Jamaica | 0.3 /100 | #268 | Tragic $75,851 |
| Cape Verdeans | 0.3 /100 | #269 | Tragic $75,848 |
| Hmong | 0.3 /100 | #270 | Tragic $75,839 |
| Pennsylvania Germans | 0.3 /100 | #271 | Tragic $75,814 |
| Somalis | 0.3 /100 | #272 | Tragic $75,782 |