Ghanaian vs Guatemalan No Schooling Completed
COMPARE
Ghanaian
Guatemalan
No Schooling Completed
No Schooling Completed Comparison
Ghanaians
Guatemalans
2.6%
NO SCHOOLING COMPLETED
0.1/ 100
METRIC RATING
274th/ 347
METRIC RANK
3.5%
NO SCHOOLING COMPLETED
0.0/ 100
METRIC RATING
334th/ 347
METRIC RANK
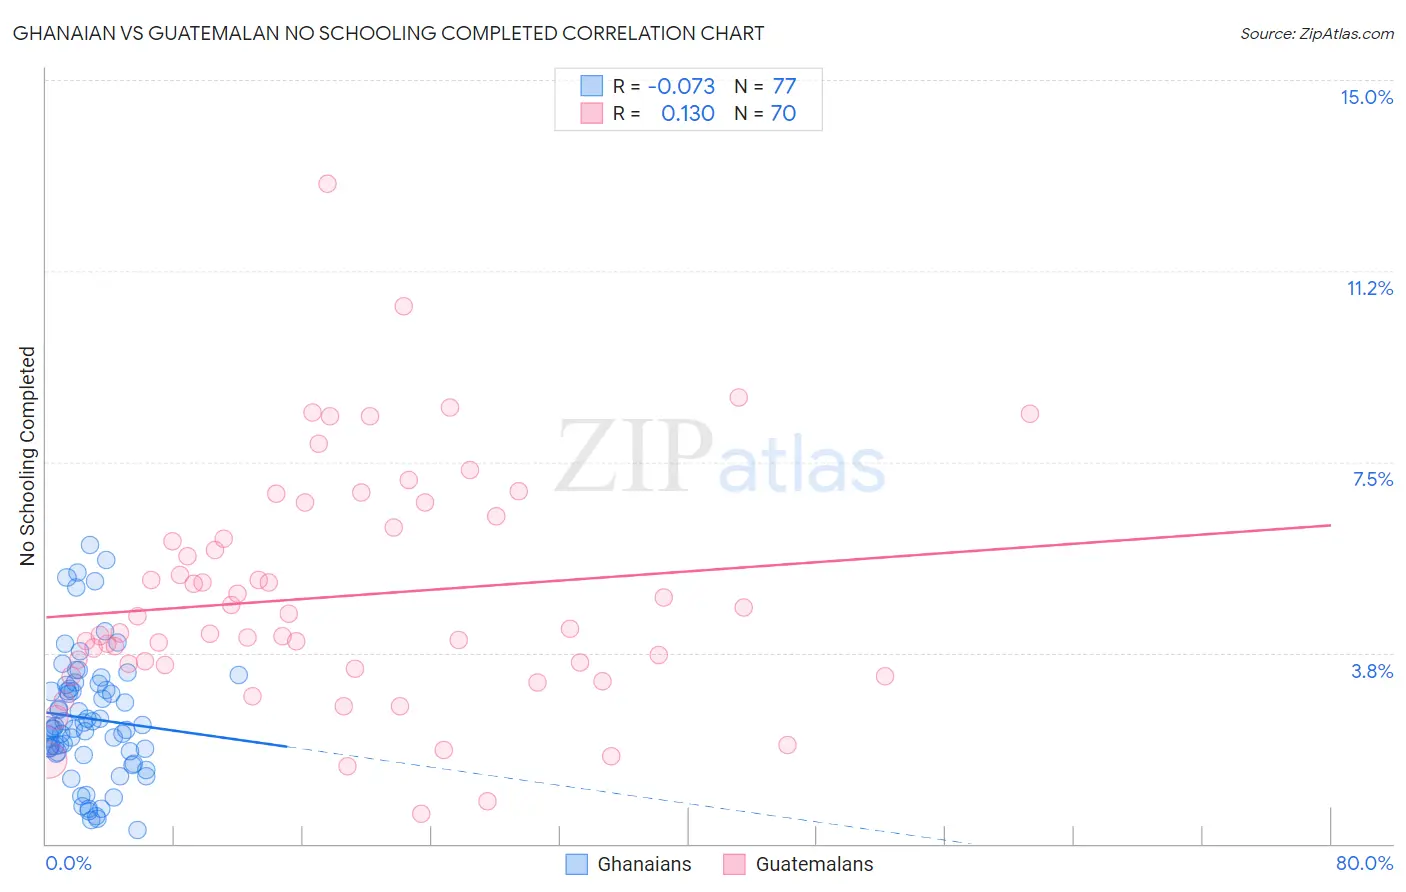
Ghanaian vs Guatemalan No Schooling Completed Correlation Chart
The statistical analysis conducted on geographies consisting of 189,718,385 people shows a slight negative correlation between the proportion of Ghanaians and percentage of population with no schooling in the United States with a correlation coefficient (R) of -0.073 and weighted average of 2.6%. Similarly, the statistical analysis conducted on geographies consisting of 406,309,514 people shows a poor positive correlation between the proportion of Guatemalans and percentage of population with no schooling in the United States with a correlation coefficient (R) of 0.130 and weighted average of 3.5%, a difference of 35.2%.
No Schooling Completed Correlation Summary
| Measurement | Ghanaian | Guatemalan |
| Minimum | 0.26% | 0.59% |
| Maximum | 5.9% | 13.0% |
| Range | 5.6% | 12.4% |
| Mean | 2.5% | 4.9% |
| Median | 2.3% | 4.2% |
| Interquartile 25% (IQ1) | 1.8% | 3.5% |
| Interquartile 75% (IQ3) | 3.1% | 6.2% |
| Interquartile Range (IQR) | 1.3% | 2.7% |
| Standard Deviation (Sample) | 1.2% | 2.3% |
| Standard Deviation (Population) | 1.2% | 2.3% |
Similar Demographics by No Schooling Completed
Demographics Similar to Ghanaians by No Schooling Completed
In terms of no schooling completed, the demographic groups most similar to Ghanaians are Immigrants from China (2.6%, a difference of 0.18%), Immigrants from Cameroon (2.5%, a difference of 0.37%), Immigrants from Western Africa (2.6%, a difference of 0.74%), Immigrants from Philippines (2.6%, a difference of 0.80%), and Immigrants from Uzbekistan (2.6%, a difference of 1.0%).
| Demographics | Rating | Rank | No Schooling Completed |
| Yuman | 0.4 /100 | #267 | Tragic 2.5% |
| Taiwanese | 0.3 /100 | #268 | Tragic 2.5% |
| Immigrants | Nigeria | 0.2 /100 | #269 | Tragic 2.5% |
| Immigrants | Peru | 0.2 /100 | #270 | Tragic 2.5% |
| Cubans | 0.2 /100 | #271 | Tragic 2.5% |
| Immigrants | Bolivia | 0.2 /100 | #272 | Tragic 2.5% |
| Immigrants | Cameroon | 0.1 /100 | #273 | Tragic 2.5% |
| Ghanaians | 0.1 /100 | #274 | Tragic 2.6% |
| Immigrants | China | 0.1 /100 | #275 | Tragic 2.6% |
| Immigrants | Western Africa | 0.1 /100 | #276 | Tragic 2.6% |
| Immigrants | Philippines | 0.1 /100 | #277 | Tragic 2.6% |
| Immigrants | Uzbekistan | 0.1 /100 | #278 | Tragic 2.6% |
| Barbadians | 0.1 /100 | #279 | Tragic 2.6% |
| Trinidadians and Tobagonians | 0.1 /100 | #280 | Tragic 2.6% |
| Afghans | 0.1 /100 | #281 | Tragic 2.6% |
Demographics Similar to Guatemalans by No Schooling Completed
In terms of no schooling completed, the demographic groups most similar to Guatemalans are Immigrants from Cambodia (3.5%, a difference of 1.0%), Immigrants from Fiji (3.5%, a difference of 1.4%), Immigrants from Dominican Republic (3.4%, a difference of 1.8%), Central American (3.4%, a difference of 1.8%), and Immigrants from Cabo Verde (3.5%, a difference of 2.1%).
| Demographics | Rating | Rank | No Schooling Completed |
| Immigrants | Latin America | 0.0 /100 | #327 | Tragic 3.3% |
| Mexicans | 0.0 /100 | #328 | Tragic 3.3% |
| Immigrants | Vietnam | 0.0 /100 | #329 | Tragic 3.3% |
| Immigrants | Armenia | 0.0 /100 | #330 | Tragic 3.3% |
| Japanese | 0.0 /100 | #331 | Tragic 3.3% |
| Central Americans | 0.0 /100 | #332 | Tragic 3.4% |
| Immigrants | Dominican Republic | 0.0 /100 | #333 | Tragic 3.4% |
| Guatemalans | 0.0 /100 | #334 | Tragic 3.5% |
| Immigrants | Cambodia | 0.0 /100 | #335 | Tragic 3.5% |
| Immigrants | Fiji | 0.0 /100 | #336 | Tragic 3.5% |
| Immigrants | Cabo Verde | 0.0 /100 | #337 | Tragic 3.5% |
| Bangladeshis | 0.0 /100 | #338 | Tragic 3.5% |
| Yakama | 0.0 /100 | #339 | Tragic 3.6% |
| Immigrants | Guatemala | 0.0 /100 | #340 | Tragic 3.6% |
| Immigrants | Central America | 0.0 /100 | #341 | Tragic 3.6% |