French vs Nigerian Householder Income Ages 45 - 64 years
COMPARE
French
Nigerian
Householder Income Ages 45 - 64 years
Householder Income Ages 45 - 64 years Comparison
French
Nigerians
$99,824
HOUSEHOLDER INCOME AGES 45 - 64 YEARS
43.8/ 100
METRIC RATING
184th/ 347
METRIC RANK
$95,492
HOUSEHOLDER INCOME AGES 45 - 64 YEARS
8.2/ 100
METRIC RATING
215th/ 347
METRIC RANK
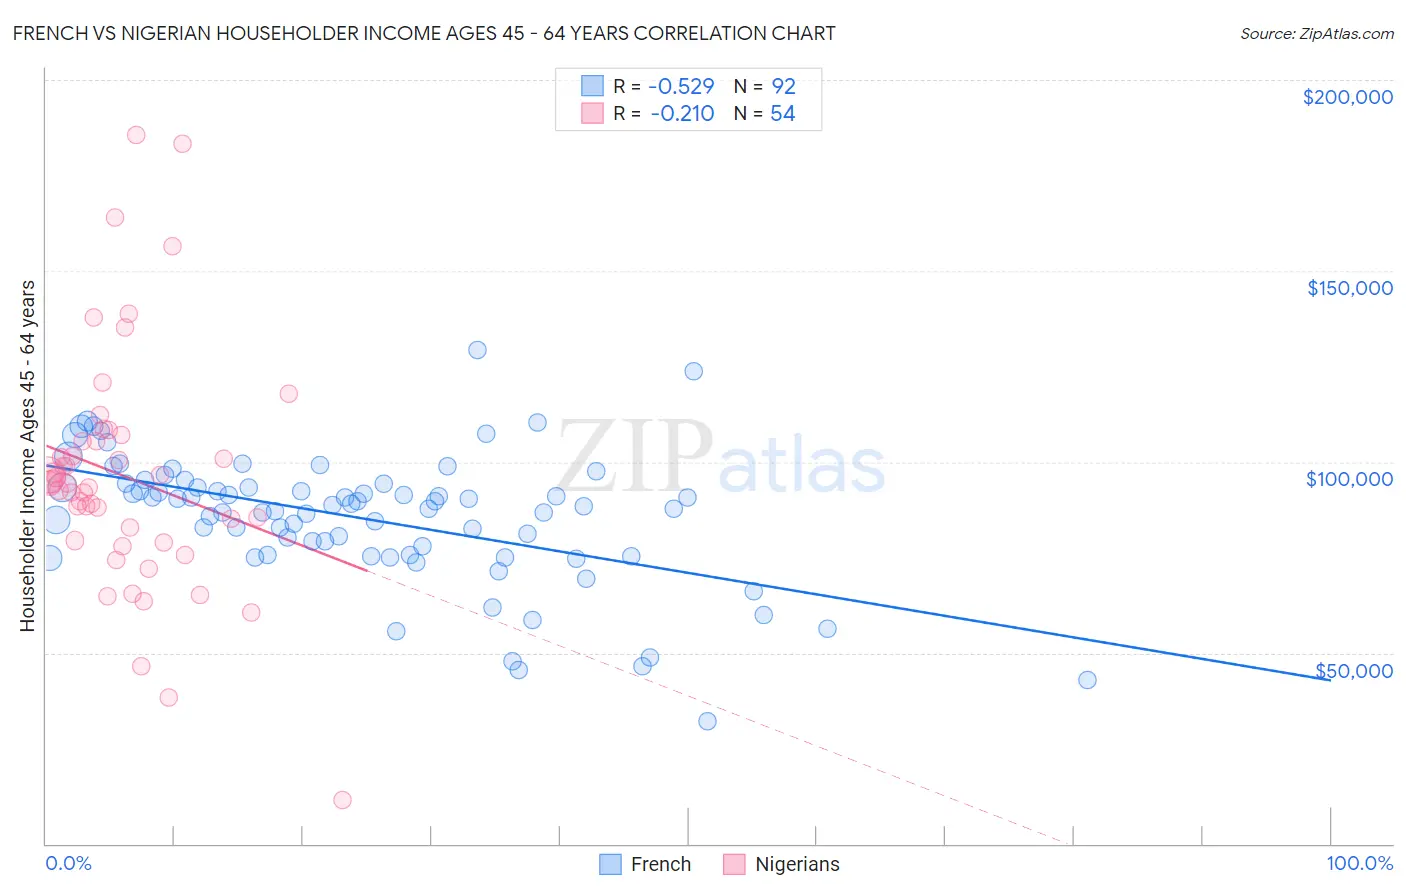
French vs Nigerian Householder Income Ages 45 - 64 years Correlation Chart
The statistical analysis conducted on geographies consisting of 568,632,779 people shows a substantial negative correlation between the proportion of French and household income with householder between the ages 45 and 64 in the United States with a correlation coefficient (R) of -0.529 and weighted average of $99,824. Similarly, the statistical analysis conducted on geographies consisting of 332,111,540 people shows a weak negative correlation between the proportion of Nigerians and household income with householder between the ages 45 and 64 in the United States with a correlation coefficient (R) of -0.210 and weighted average of $95,492, a difference of 4.5%.
Householder Income Ages 45 - 64 years Correlation Summary
| Measurement | French | Nigerian |
| Minimum | $32,031 | $11,458 |
| Maximum | $129,396 | $185,761 |
| Range | $97,365 | $174,303 |
| Mean | $85,264 | $96,275 |
| Median | $88,490 | $94,283 |
| Interquartile 25% (IQ1) | $75,583 | $79,390 |
| Interquartile 75% (IQ3) | $93,777 | $105,427 |
| Interquartile Range (IQR) | $18,194 | $26,037 |
| Standard Deviation (Sample) | $17,163 | $31,417 |
| Standard Deviation (Population) | $17,070 | $31,125 |
Similar Demographics by Householder Income Ages 45 - 64 years
Demographics Similar to French by Householder Income Ages 45 - 64 years
In terms of householder income ages 45 - 64 years, the demographic groups most similar to French are Colombian ($99,772, a difference of 0.050%), Spaniard ($99,889, a difference of 0.070%), Finnish ($99,904, a difference of 0.080%), Immigrants ($99,943, a difference of 0.12%), and Dutch ($99,650, a difference of 0.17%).
| Demographics | Rating | Rank | Householder Income Ages 45 - 64 years |
| Moroccans | 47.7 /100 | #177 | Average $100,138 |
| Immigrants | Cameroon | 47.0 /100 | #178 | Average $100,084 |
| Belgians | 46.7 /100 | #179 | Average $100,060 |
| Aleuts | 46.6 /100 | #180 | Average $100,052 |
| Immigrants | Immigrants | 45.3 /100 | #181 | Average $99,943 |
| Finns | 44.8 /100 | #182 | Average $99,904 |
| Spaniards | 44.6 /100 | #183 | Average $99,889 |
| French | 43.8 /100 | #184 | Average $99,824 |
| Colombians | 43.2 /100 | #185 | Average $99,772 |
| Dutch | 41.7 /100 | #186 | Average $99,650 |
| Iraqis | 38.5 /100 | #187 | Fair $99,387 |
| Immigrants | Portugal | 36.3 /100 | #188 | Fair $99,203 |
| Immigrants | South America | 35.4 /100 | #189 | Fair $99,126 |
| French Canadians | 35.1 /100 | #190 | Fair $99,093 |
| Kenyans | 33.7 /100 | #191 | Fair $98,970 |
Demographics Similar to Nigerians by Householder Income Ages 45 - 64 years
In terms of householder income ages 45 - 64 years, the demographic groups most similar to Nigerians are Immigrants from Venezuela ($95,342, a difference of 0.16%), Immigrants from Ghana ($94,982, a difference of 0.54%), Panamanian ($96,066, a difference of 0.60%), Delaware ($94,914, a difference of 0.61%), and Immigrants from Uruguay ($96,086, a difference of 0.62%).
| Demographics | Rating | Rank | Householder Income Ages 45 - 64 years |
| Scotch-Irish | 16.4 /100 | #208 | Poor $97,073 |
| Japanese | 14.8 /100 | #209 | Poor $96,834 |
| Tsimshian | 14.5 /100 | #210 | Poor $96,783 |
| Immigrants | Cambodia | 13.0 /100 | #211 | Poor $96,537 |
| Venezuelans | 12.6 /100 | #212 | Poor $96,460 |
| Immigrants | Uruguay | 10.7 /100 | #213 | Poor $96,086 |
| Panamanians | 10.6 /100 | #214 | Poor $96,066 |
| Nigerians | 8.2 /100 | #215 | Tragic $95,492 |
| Immigrants | Venezuela | 7.6 /100 | #216 | Tragic $95,342 |
| Immigrants | Ghana | 6.4 /100 | #217 | Tragic $94,982 |
| Delaware | 6.2 /100 | #218 | Tragic $94,914 |
| Immigrants | Armenia | 6.1 /100 | #219 | Tragic $94,863 |
| Salvadorans | 6.0 /100 | #220 | Tragic $94,842 |
| Immigrants | Nigeria | 5.9 /100 | #221 | Tragic $94,804 |
| Malaysians | 5.2 /100 | #222 | Tragic $94,517 |