French vs Mexican Householder Income Ages 45 - 64 years
COMPARE
French
Mexican
Householder Income Ages 45 - 64 years
Householder Income Ages 45 - 64 years Comparison
French
Mexicans
$99,824
HOUSEHOLDER INCOME AGES 45 - 64 YEARS
43.8/ 100
METRIC RATING
184th/ 347
METRIC RANK
$86,816
HOUSEHOLDER INCOME AGES 45 - 64 YEARS
0.1/ 100
METRIC RATING
283rd/ 347
METRIC RANK
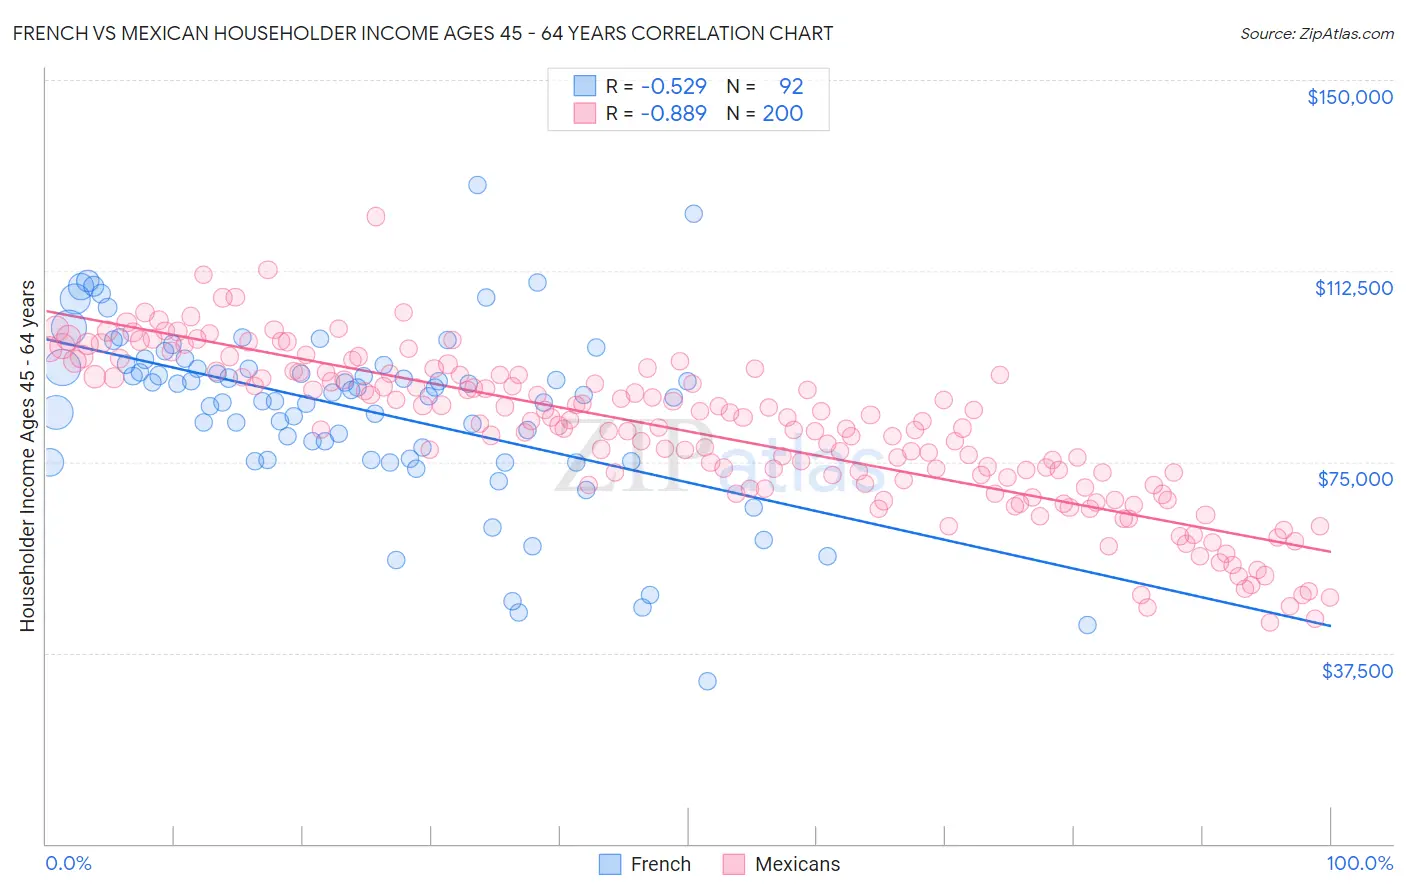
French vs Mexican Householder Income Ages 45 - 64 years Correlation Chart
The statistical analysis conducted on geographies consisting of 568,632,779 people shows a substantial negative correlation between the proportion of French and household income with householder between the ages 45 and 64 in the United States with a correlation coefficient (R) of -0.529 and weighted average of $99,824. Similarly, the statistical analysis conducted on geographies consisting of 561,629,225 people shows a very strong negative correlation between the proportion of Mexicans and household income with householder between the ages 45 and 64 in the United States with a correlation coefficient (R) of -0.889 and weighted average of $86,816, a difference of 15.0%.
Householder Income Ages 45 - 64 years Correlation Summary
| Measurement | French | Mexican |
| Minimum | $32,031 | $43,450 |
| Maximum | $129,396 | $123,118 |
| Range | $97,365 | $79,668 |
| Mean | $85,264 | $80,968 |
| Median | $88,490 | $82,307 |
| Interquartile 25% (IQ1) | $75,583 | $70,470 |
| Interquartile 75% (IQ3) | $93,777 | $92,226 |
| Interquartile Range (IQR) | $18,194 | $21,757 |
| Standard Deviation (Sample) | $17,163 | $15,403 |
| Standard Deviation (Population) | $17,070 | $15,365 |
Similar Demographics by Householder Income Ages 45 - 64 years
Demographics Similar to French by Householder Income Ages 45 - 64 years
In terms of householder income ages 45 - 64 years, the demographic groups most similar to French are Colombian ($99,772, a difference of 0.050%), Spaniard ($99,889, a difference of 0.070%), Finnish ($99,904, a difference of 0.080%), Immigrants ($99,943, a difference of 0.12%), and Dutch ($99,650, a difference of 0.17%).
| Demographics | Rating | Rank | Householder Income Ages 45 - 64 years |
| Moroccans | 47.7 /100 | #177 | Average $100,138 |
| Immigrants | Cameroon | 47.0 /100 | #178 | Average $100,084 |
| Belgians | 46.7 /100 | #179 | Average $100,060 |
| Aleuts | 46.6 /100 | #180 | Average $100,052 |
| Immigrants | Immigrants | 45.3 /100 | #181 | Average $99,943 |
| Finns | 44.8 /100 | #182 | Average $99,904 |
| Spaniards | 44.6 /100 | #183 | Average $99,889 |
| French | 43.8 /100 | #184 | Average $99,824 |
| Colombians | 43.2 /100 | #185 | Average $99,772 |
| Dutch | 41.7 /100 | #186 | Average $99,650 |
| Iraqis | 38.5 /100 | #187 | Fair $99,387 |
| Immigrants | Portugal | 36.3 /100 | #188 | Fair $99,203 |
| Immigrants | South America | 35.4 /100 | #189 | Fair $99,126 |
| French Canadians | 35.1 /100 | #190 | Fair $99,093 |
| Kenyans | 33.7 /100 | #191 | Fair $98,970 |
Demographics Similar to Mexicans by Householder Income Ages 45 - 64 years
In terms of householder income ages 45 - 64 years, the demographic groups most similar to Mexicans are Central American Indian ($86,764, a difference of 0.060%), Senegalese ($86,897, a difference of 0.090%), Yaqui ($86,914, a difference of 0.11%), Yakama ($86,992, a difference of 0.20%), and Immigrants from Somalia ($86,987, a difference of 0.20%).
| Demographics | Rating | Rank | Householder Income Ages 45 - 64 years |
| Immigrants | Latin America | 0.1 /100 | #276 | Tragic $87,219 |
| Cree | 0.1 /100 | #277 | Tragic $87,185 |
| Immigrants | Jamaica | 0.1 /100 | #278 | Tragic $87,035 |
| Yakama | 0.1 /100 | #279 | Tragic $86,992 |
| Immigrants | Somalia | 0.1 /100 | #280 | Tragic $86,987 |
| Yaqui | 0.1 /100 | #281 | Tragic $86,914 |
| Senegalese | 0.1 /100 | #282 | Tragic $86,897 |
| Mexicans | 0.1 /100 | #283 | Tragic $86,816 |
| Central American Indians | 0.1 /100 | #284 | Tragic $86,764 |
| Blackfeet | 0.1 /100 | #285 | Tragic $86,595 |
| Immigrants | Guatemala | 0.1 /100 | #286 | Tragic $86,573 |
| Bangladeshis | 0.1 /100 | #287 | Tragic $86,402 |
| Immigrants | St. Vincent and the Grenadines | 0.1 /100 | #288 | Tragic $86,394 |
| Cubans | 0.1 /100 | #289 | Tragic $86,301 |
| Cherokee | 0.1 /100 | #290 | Tragic $86,125 |