French Canadian vs Scandinavian Householder Income Ages 45 - 64 years
COMPARE
French Canadian
Scandinavian
Householder Income Ages 45 - 64 years
Householder Income Ages 45 - 64 years Comparison
French Canadians
Scandinavians
$99,093
HOUSEHOLDER INCOME AGES 45 - 64 YEARS
35.1/ 100
METRIC RATING
190th/ 347
METRIC RANK
$102,969
HOUSEHOLDER INCOME AGES 45 - 64 YEARS
79.0/ 100
METRIC RATING
153rd/ 347
METRIC RANK
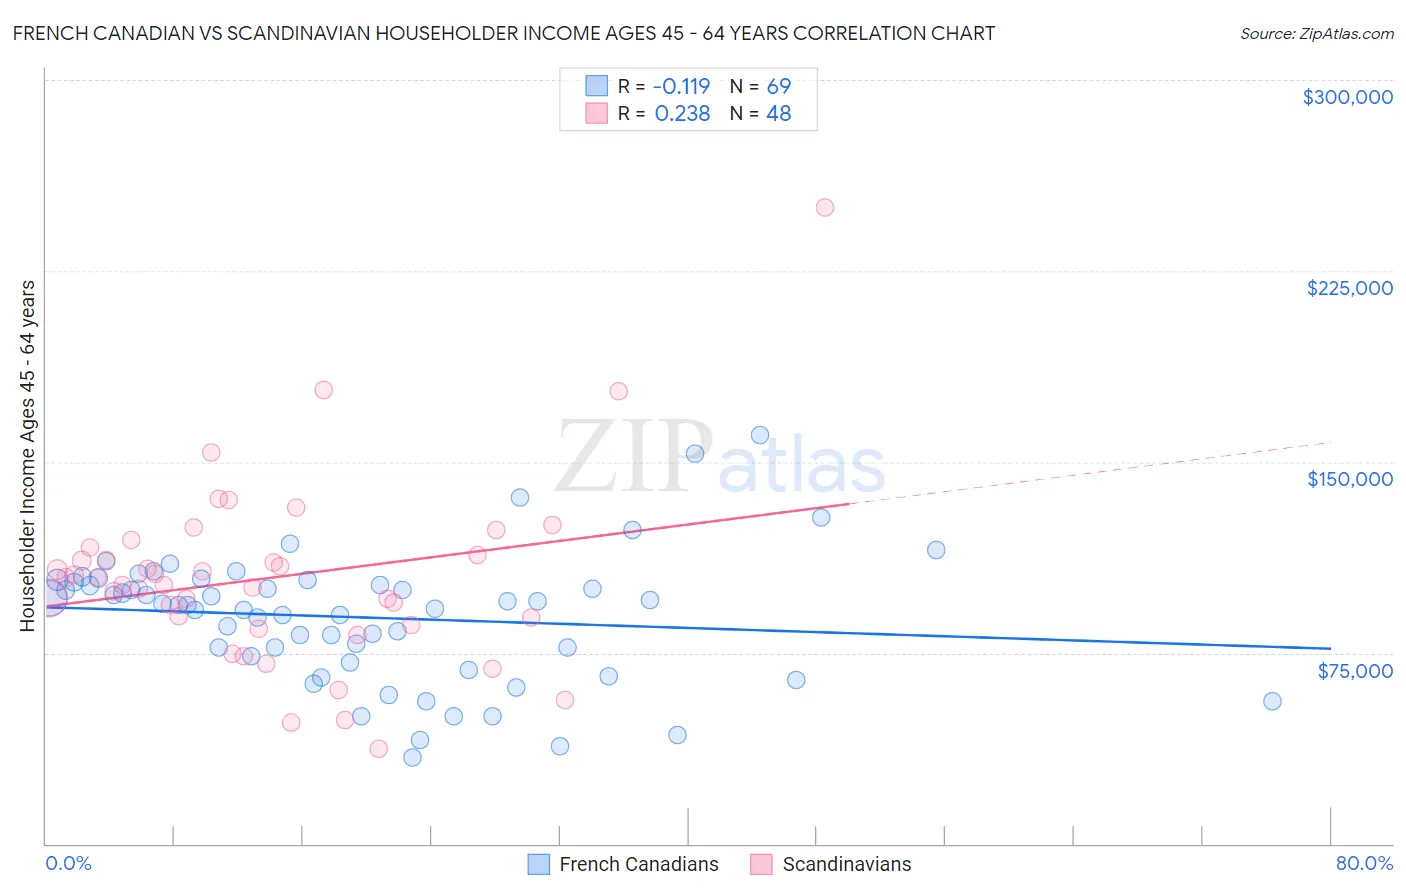
French Canadian vs Scandinavian Householder Income Ages 45 - 64 years Correlation Chart
The statistical analysis conducted on geographies consisting of 500,903,469 people shows a poor negative correlation between the proportion of French Canadians and household income with householder between the ages 45 and 64 in the United States with a correlation coefficient (R) of -0.119 and weighted average of $99,093. Similarly, the statistical analysis conducted on geographies consisting of 471,257,536 people shows a weak positive correlation between the proportion of Scandinavians and household income with householder between the ages 45 and 64 in the United States with a correlation coefficient (R) of 0.238 and weighted average of $102,969, a difference of 3.9%.
Householder Income Ages 45 - 64 years Correlation Summary
| Measurement | French Canadian | Scandinavian |
| Minimum | $33,899 | $37,396 |
| Maximum | $160,455 | $250,001 |
| Range | $126,556 | $212,605 |
| Mean | $88,921 | $104,566 |
| Median | $93,815 | $103,110 |
| Interquartile 25% (IQ1) | $72,379 | $87,340 |
| Interquartile 75% (IQ3) | $103,210 | $114,988 |
| Interquartile Range (IQR) | $30,831 | $27,648 |
| Standard Deviation (Sample) | $25,131 | $35,851 |
| Standard Deviation (Population) | $24,948 | $35,476 |
Similar Demographics by Householder Income Ages 45 - 64 years
Demographics Similar to French Canadians by Householder Income Ages 45 - 64 years
In terms of householder income ages 45 - 64 years, the demographic groups most similar to French Canadians are Immigrants from South America ($99,126, a difference of 0.030%), Immigrants from Portugal ($99,203, a difference of 0.11%), Kenyan ($98,970, a difference of 0.12%), Celtic ($98,896, a difference of 0.20%), and Iraqi ($99,387, a difference of 0.30%).
| Demographics | Rating | Rank | Householder Income Ages 45 - 64 years |
| Spaniards | 44.6 /100 | #183 | Average $99,889 |
| French | 43.8 /100 | #184 | Average $99,824 |
| Colombians | 43.2 /100 | #185 | Average $99,772 |
| Dutch | 41.7 /100 | #186 | Average $99,650 |
| Iraqis | 38.5 /100 | #187 | Fair $99,387 |
| Immigrants | Portugal | 36.3 /100 | #188 | Fair $99,203 |
| Immigrants | South America | 35.4 /100 | #189 | Fair $99,126 |
| French Canadians | 35.1 /100 | #190 | Fair $99,093 |
| Kenyans | 33.7 /100 | #191 | Fair $98,970 |
| Celtics | 32.9 /100 | #192 | Fair $98,896 |
| Hawaiians | 31.6 /100 | #193 | Fair $98,778 |
| Uruguayans | 30.3 /100 | #194 | Fair $98,660 |
| Spanish | 29.2 /100 | #195 | Fair $98,554 |
| Immigrants | Eastern Africa | 28.3 /100 | #196 | Fair $98,467 |
| Puget Sound Salish | 27.0 /100 | #197 | Fair $98,340 |
Demographics Similar to Scandinavians by Householder Income Ages 45 - 64 years
In terms of householder income ages 45 - 64 years, the demographic groups most similar to Scandinavians are Slovene ($102,885, a difference of 0.080%), Irish ($103,067, a difference of 0.090%), Swiss ($103,071, a difference of 0.10%), Costa Rican ($102,779, a difference of 0.19%), and Carpatho Rusyn ($102,777, a difference of 0.19%).
| Demographics | Rating | Rank | Householder Income Ages 45 - 64 years |
| Immigrants | Chile | 82.5 /100 | #146 | Excellent $103,412 |
| Basques | 82.3 /100 | #147 | Excellent $103,387 |
| Immigrants | Germany | 81.5 /100 | #148 | Excellent $103,282 |
| Immigrants | Sierra Leone | 81.1 /100 | #149 | Excellent $103,227 |
| Immigrants | Peru | 80.7 /100 | #150 | Excellent $103,173 |
| Swiss | 79.9 /100 | #151 | Good $103,071 |
| Irish | 79.8 /100 | #152 | Good $103,067 |
| Scandinavians | 79.0 /100 | #153 | Good $102,969 |
| Slovenes | 78.3 /100 | #154 | Good $102,885 |
| Costa Ricans | 77.4 /100 | #155 | Good $102,779 |
| Carpatho Rusyns | 77.4 /100 | #156 | Good $102,777 |
| Immigrants | Ethiopia | 77.3 /100 | #157 | Good $102,763 |
| Slavs | 76.1 /100 | #158 | Good $102,629 |
| Sierra Leoneans | 74.2 /100 | #159 | Good $102,427 |
| Icelanders | 72.5 /100 | #160 | Good $102,261 |