French Canadian vs French Householder Income Ages 45 - 64 years
COMPARE
French Canadian
French
Householder Income Ages 45 - 64 years
Householder Income Ages 45 - 64 years Comparison
French Canadians
French
$99,093
HOUSEHOLDER INCOME AGES 45 - 64 YEARS
35.1/ 100
METRIC RATING
190th/ 347
METRIC RANK
$99,824
HOUSEHOLDER INCOME AGES 45 - 64 YEARS
43.8/ 100
METRIC RATING
184th/ 347
METRIC RANK
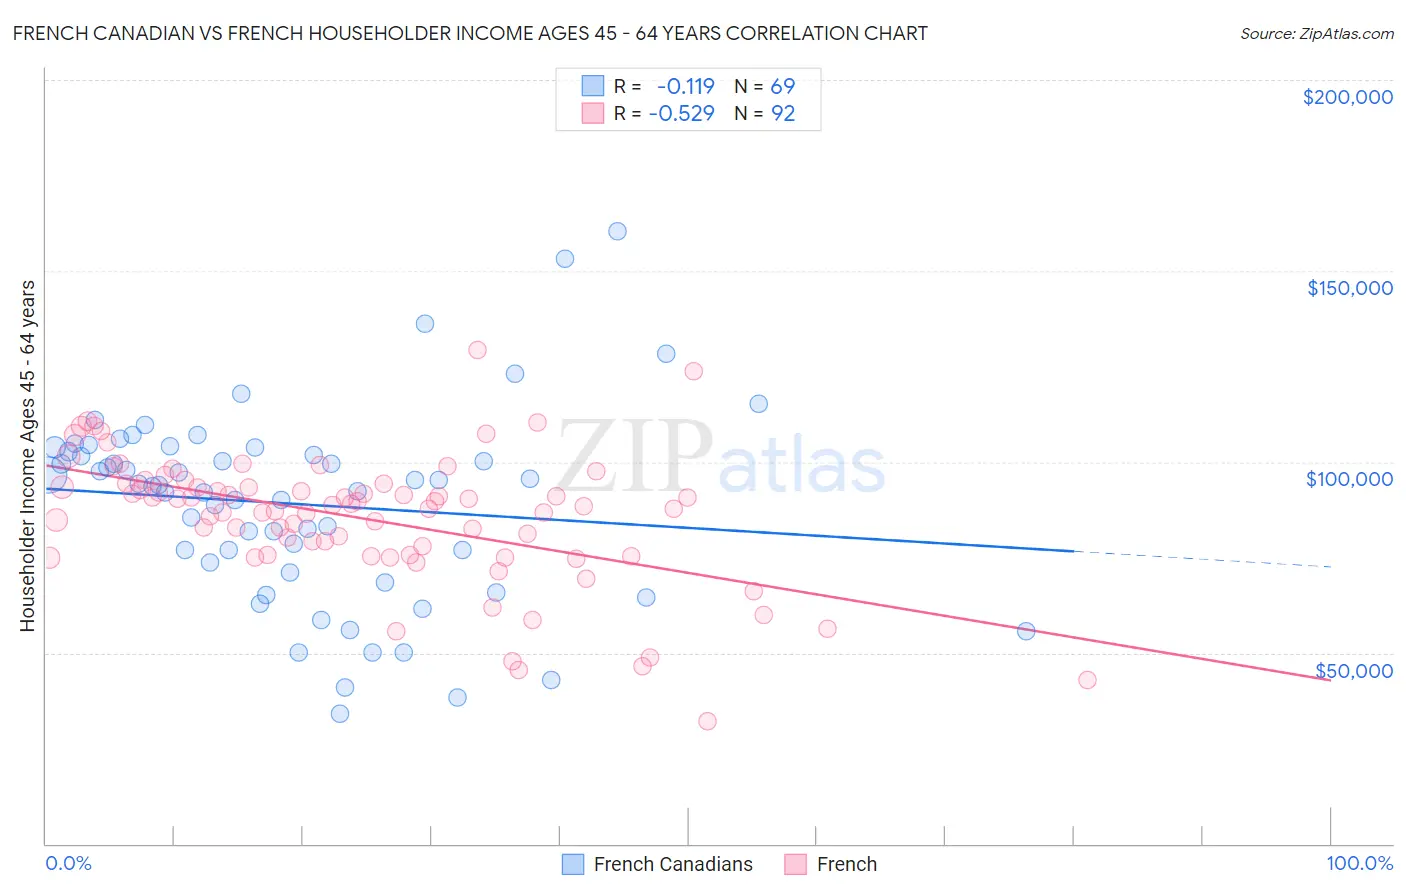
French Canadian vs French Householder Income Ages 45 - 64 years Correlation Chart
The statistical analysis conducted on geographies consisting of 500,903,469 people shows a poor negative correlation between the proportion of French Canadians and household income with householder between the ages 45 and 64 in the United States with a correlation coefficient (R) of -0.119 and weighted average of $99,093. Similarly, the statistical analysis conducted on geographies consisting of 568,632,779 people shows a substantial negative correlation between the proportion of French and household income with householder between the ages 45 and 64 in the United States with a correlation coefficient (R) of -0.529 and weighted average of $99,824, a difference of 0.74%.
Householder Income Ages 45 - 64 years Correlation Summary
| Measurement | French Canadian | French |
| Minimum | $33,899 | $32,031 |
| Maximum | $160,455 | $129,396 |
| Range | $126,556 | $97,365 |
| Mean | $88,921 | $85,264 |
| Median | $93,815 | $88,490 |
| Interquartile 25% (IQ1) | $72,379 | $75,583 |
| Interquartile 75% (IQ3) | $103,210 | $93,777 |
| Interquartile Range (IQR) | $30,831 | $18,194 |
| Standard Deviation (Sample) | $25,131 | $17,163 |
| Standard Deviation (Population) | $24,948 | $17,070 |
Demographics Similar to French Canadians and French by Householder Income Ages 45 - 64 years
In terms of householder income ages 45 - 64 years, the demographic groups most similar to French Canadians are Immigrants from South America ($99,126, a difference of 0.030%), Immigrants from Portugal ($99,203, a difference of 0.11%), Kenyan ($98,970, a difference of 0.12%), Celtic ($98,896, a difference of 0.20%), and Iraqi ($99,387, a difference of 0.30%). Similarly, the demographic groups most similar to French are Colombian ($99,772, a difference of 0.050%), Spaniard ($99,889, a difference of 0.070%), Finnish ($99,904, a difference of 0.080%), Immigrants ($99,943, a difference of 0.12%), and Dutch ($99,650, a difference of 0.17%).
| Demographics | Rating | Rank | Householder Income Ages 45 - 64 years |
| Moroccans | 47.7 /100 | #177 | Average $100,138 |
| Immigrants | Cameroon | 47.0 /100 | #178 | Average $100,084 |
| Belgians | 46.7 /100 | #179 | Average $100,060 |
| Aleuts | 46.6 /100 | #180 | Average $100,052 |
| Immigrants | Immigrants | 45.3 /100 | #181 | Average $99,943 |
| Finns | 44.8 /100 | #182 | Average $99,904 |
| Spaniards | 44.6 /100 | #183 | Average $99,889 |
| French | 43.8 /100 | #184 | Average $99,824 |
| Colombians | 43.2 /100 | #185 | Average $99,772 |
| Dutch | 41.7 /100 | #186 | Average $99,650 |
| Iraqis | 38.5 /100 | #187 | Fair $99,387 |
| Immigrants | Portugal | 36.3 /100 | #188 | Fair $99,203 |
| Immigrants | South America | 35.4 /100 | #189 | Fair $99,126 |
| French Canadians | 35.1 /100 | #190 | Fair $99,093 |
| Kenyans | 33.7 /100 | #191 | Fair $98,970 |
| Celtics | 32.9 /100 | #192 | Fair $98,896 |
| Hawaiians | 31.6 /100 | #193 | Fair $98,778 |
| Uruguayans | 30.3 /100 | #194 | Fair $98,660 |
| Spanish | 29.2 /100 | #195 | Fair $98,554 |
| Immigrants | Eastern Africa | 28.3 /100 | #196 | Fair $98,467 |
| Puget Sound Salish | 27.0 /100 | #197 | Fair $98,340 |