French Canadian vs Immigrants from Austria Householder Income Ages 45 - 64 years
COMPARE
French Canadian
Immigrants from Austria
Householder Income Ages 45 - 64 years
Householder Income Ages 45 - 64 years Comparison
French Canadians
Immigrants from Austria
$99,093
HOUSEHOLDER INCOME AGES 45 - 64 YEARS
35.1/ 100
METRIC RATING
190th/ 347
METRIC RANK
$113,140
HOUSEHOLDER INCOME AGES 45 - 64 YEARS
99.8/ 100
METRIC RATING
50th/ 347
METRIC RANK
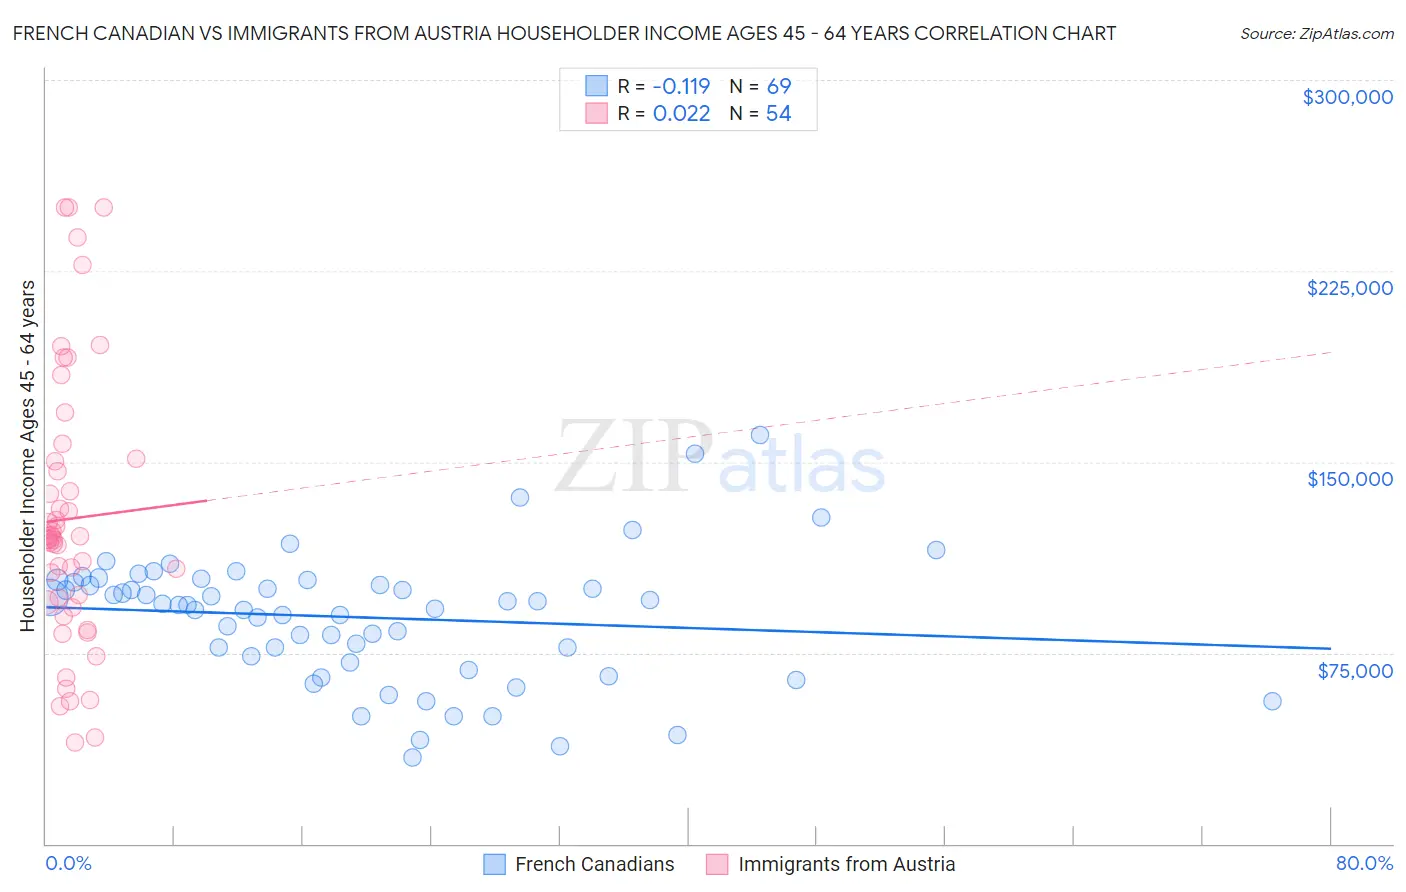
French Canadian vs Immigrants from Austria Householder Income Ages 45 - 64 years Correlation Chart
The statistical analysis conducted on geographies consisting of 500,903,469 people shows a poor negative correlation between the proportion of French Canadians and household income with householder between the ages 45 and 64 in the United States with a correlation coefficient (R) of -0.119 and weighted average of $99,093. Similarly, the statistical analysis conducted on geographies consisting of 167,924,064 people shows no correlation between the proportion of Immigrants from Austria and household income with householder between the ages 45 and 64 in the United States with a correlation coefficient (R) of 0.022 and weighted average of $113,140, a difference of 14.2%.
Householder Income Ages 45 - 64 years Correlation Summary
| Measurement | French Canadian | Immigrants from Austria |
| Minimum | $33,899 | $39,554 |
| Maximum | $160,455 | $250,001 |
| Range | $126,556 | $210,447 |
| Mean | $88,921 | $127,653 |
| Median | $93,815 | $120,029 |
| Interquartile 25% (IQ1) | $72,379 | $95,004 |
| Interquartile 75% (IQ3) | $103,210 | $150,192 |
| Interquartile Range (IQR) | $30,831 | $55,187 |
| Standard Deviation (Sample) | $25,131 | $52,842 |
| Standard Deviation (Population) | $24,948 | $52,351 |
Similar Demographics by Householder Income Ages 45 - 64 years
Demographics Similar to French Canadians by Householder Income Ages 45 - 64 years
In terms of householder income ages 45 - 64 years, the demographic groups most similar to French Canadians are Immigrants from South America ($99,126, a difference of 0.030%), Immigrants from Portugal ($99,203, a difference of 0.11%), Kenyan ($98,970, a difference of 0.12%), Celtic ($98,896, a difference of 0.20%), and Iraqi ($99,387, a difference of 0.30%).
| Demographics | Rating | Rank | Householder Income Ages 45 - 64 years |
| Spaniards | 44.6 /100 | #183 | Average $99,889 |
| French | 43.8 /100 | #184 | Average $99,824 |
| Colombians | 43.2 /100 | #185 | Average $99,772 |
| Dutch | 41.7 /100 | #186 | Average $99,650 |
| Iraqis | 38.5 /100 | #187 | Fair $99,387 |
| Immigrants | Portugal | 36.3 /100 | #188 | Fair $99,203 |
| Immigrants | South America | 35.4 /100 | #189 | Fair $99,126 |
| French Canadians | 35.1 /100 | #190 | Fair $99,093 |
| Kenyans | 33.7 /100 | #191 | Fair $98,970 |
| Celtics | 32.9 /100 | #192 | Fair $98,896 |
| Hawaiians | 31.6 /100 | #193 | Fair $98,778 |
| Uruguayans | 30.3 /100 | #194 | Fair $98,660 |
| Spanish | 29.2 /100 | #195 | Fair $98,554 |
| Immigrants | Eastern Africa | 28.3 /100 | #196 | Fair $98,467 |
| Puget Sound Salish | 27.0 /100 | #197 | Fair $98,340 |
Demographics Similar to Immigrants from Austria by Householder Income Ages 45 - 64 years
In terms of householder income ages 45 - 64 years, the demographic groups most similar to Immigrants from Austria are Immigrants from Russia ($113,215, a difference of 0.070%), Immigrants from South Africa ($112,886, a difference of 0.22%), Immigrants from Malaysia ($112,796, a difference of 0.30%), Immigrants from Indonesia ($113,519, a difference of 0.34%), and Australian ($113,533, a difference of 0.35%).
| Demographics | Rating | Rank | Householder Income Ages 45 - 64 years |
| Israelis | 99.9 /100 | #43 | Exceptional $114,186 |
| Bulgarians | 99.9 /100 | #44 | Exceptional $113,883 |
| Immigrants | France | 99.9 /100 | #45 | Exceptional $113,680 |
| Immigrants | Greece | 99.9 /100 | #46 | Exceptional $113,548 |
| Australians | 99.9 /100 | #47 | Exceptional $113,533 |
| Immigrants | Indonesia | 99.9 /100 | #48 | Exceptional $113,519 |
| Immigrants | Russia | 99.8 /100 | #49 | Exceptional $113,215 |
| Immigrants | Austria | 99.8 /100 | #50 | Exceptional $113,140 |
| Immigrants | South Africa | 99.8 /100 | #51 | Exceptional $112,886 |
| Immigrants | Malaysia | 99.8 /100 | #52 | Exceptional $112,796 |
| Afghans | 99.8 /100 | #53 | Exceptional $112,676 |
| Greeks | 99.8 /100 | #54 | Exceptional $112,630 |
| Lithuanians | 99.8 /100 | #55 | Exceptional $112,484 |
| Egyptians | 99.7 /100 | #56 | Exceptional $112,256 |
| Immigrants | Scotland | 99.7 /100 | #57 | Exceptional $112,175 |