French Canadian vs Shoshone Householder Income Ages 45 - 64 years
COMPARE
French Canadian
Shoshone
Householder Income Ages 45 - 64 years
Householder Income Ages 45 - 64 years Comparison
French Canadians
Shoshone
$99,093
HOUSEHOLDER INCOME AGES 45 - 64 YEARS
35.1/ 100
METRIC RATING
190th/ 347
METRIC RANK
$83,588
HOUSEHOLDER INCOME AGES 45 - 64 YEARS
0.0/ 100
METRIC RATING
307th/ 347
METRIC RANK
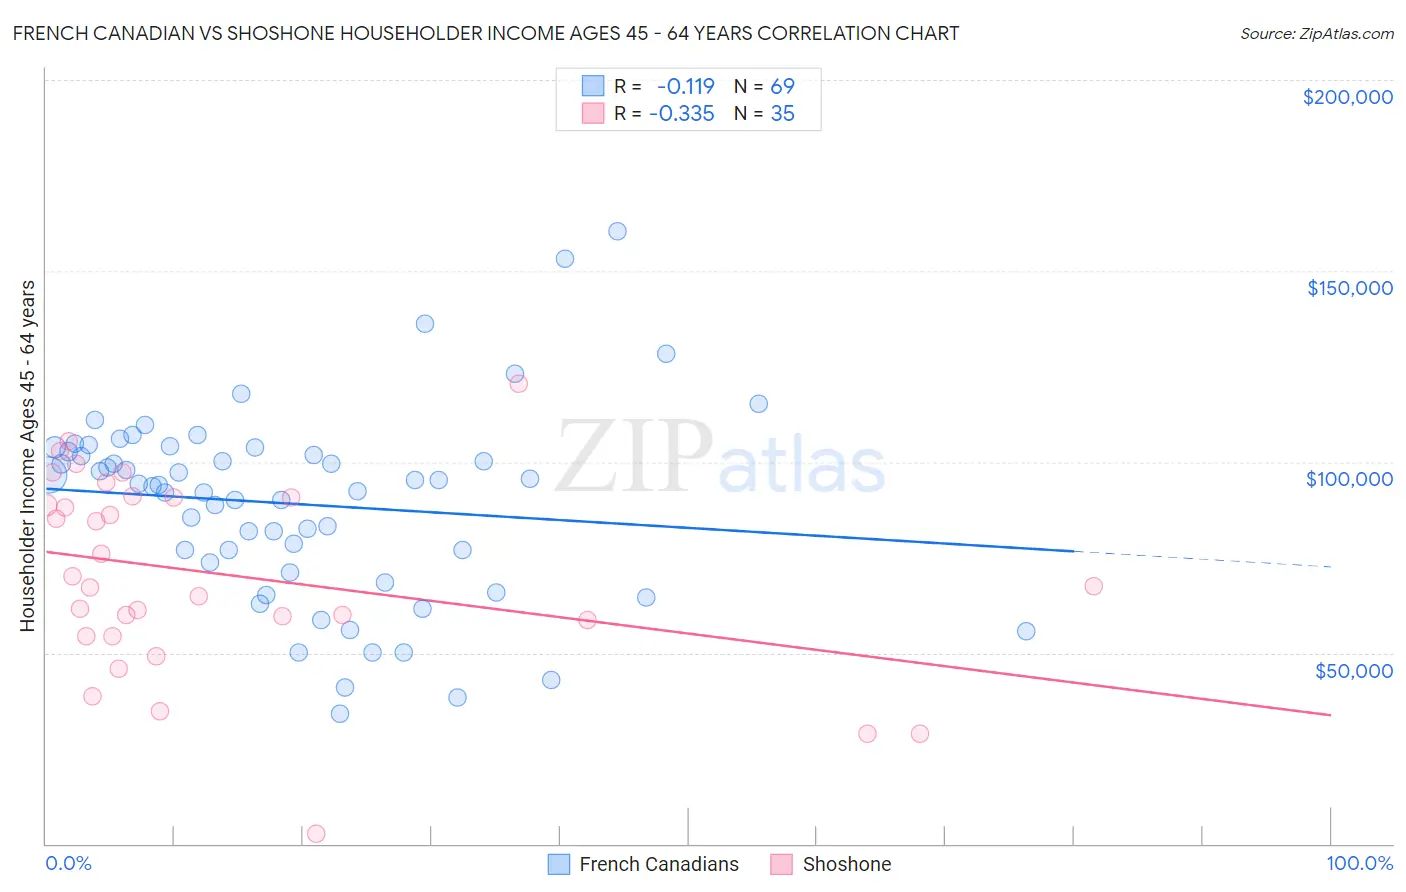
French Canadian vs Shoshone Householder Income Ages 45 - 64 years Correlation Chart
The statistical analysis conducted on geographies consisting of 500,903,469 people shows a poor negative correlation between the proportion of French Canadians and household income with householder between the ages 45 and 64 in the United States with a correlation coefficient (R) of -0.119 and weighted average of $99,093. Similarly, the statistical analysis conducted on geographies consisting of 66,599,308 people shows a mild negative correlation between the proportion of Shoshone and household income with householder between the ages 45 and 64 in the United States with a correlation coefficient (R) of -0.335 and weighted average of $83,588, a difference of 18.5%.
Householder Income Ages 45 - 64 years Correlation Summary
| Measurement | French Canadian | Shoshone |
| Minimum | $33,899 | $2,499 |
| Maximum | $160,455 | $120,500 |
| Range | $126,556 | $118,001 |
| Mean | $88,921 | $70,433 |
| Median | $93,815 | $67,500 |
| Interquartile 25% (IQ1) | $72,379 | $54,344 |
| Interquartile 75% (IQ3) | $103,210 | $90,536 |
| Interquartile Range (IQR) | $30,831 | $36,192 |
| Standard Deviation (Sample) | $25,131 | $25,918 |
| Standard Deviation (Population) | $24,948 | $25,545 |
Similar Demographics by Householder Income Ages 45 - 64 years
Demographics Similar to French Canadians by Householder Income Ages 45 - 64 years
In terms of householder income ages 45 - 64 years, the demographic groups most similar to French Canadians are Immigrants from South America ($99,126, a difference of 0.030%), Immigrants from Portugal ($99,203, a difference of 0.11%), Kenyan ($98,970, a difference of 0.12%), Celtic ($98,896, a difference of 0.20%), and Iraqi ($99,387, a difference of 0.30%).
| Demographics | Rating | Rank | Householder Income Ages 45 - 64 years |
| Spaniards | 44.6 /100 | #183 | Average $99,889 |
| French | 43.8 /100 | #184 | Average $99,824 |
| Colombians | 43.2 /100 | #185 | Average $99,772 |
| Dutch | 41.7 /100 | #186 | Average $99,650 |
| Iraqis | 38.5 /100 | #187 | Fair $99,387 |
| Immigrants | Portugal | 36.3 /100 | #188 | Fair $99,203 |
| Immigrants | South America | 35.4 /100 | #189 | Fair $99,126 |
| French Canadians | 35.1 /100 | #190 | Fair $99,093 |
| Kenyans | 33.7 /100 | #191 | Fair $98,970 |
| Celtics | 32.9 /100 | #192 | Fair $98,896 |
| Hawaiians | 31.6 /100 | #193 | Fair $98,778 |
| Uruguayans | 30.3 /100 | #194 | Fair $98,660 |
| Spanish | 29.2 /100 | #195 | Fair $98,554 |
| Immigrants | Eastern Africa | 28.3 /100 | #196 | Fair $98,467 |
| Puget Sound Salish | 27.0 /100 | #197 | Fair $98,340 |
Demographics Similar to Shoshone by Householder Income Ages 45 - 64 years
In terms of householder income ages 45 - 64 years, the demographic groups most similar to Shoshone are Immigrants from Cabo Verde ($83,542, a difference of 0.060%), Immigrants from Dominica ($83,311, a difference of 0.33%), Immigrants from Haiti ($83,257, a difference of 0.40%), Ute ($83,937, a difference of 0.42%), and Chippewa ($83,943, a difference of 0.43%).
| Demographics | Rating | Rank | Householder Income Ages 45 - 64 years |
| Indonesians | 0.0 /100 | #300 | Tragic $84,890 |
| Potawatomi | 0.0 /100 | #301 | Tragic $84,613 |
| Haitians | 0.0 /100 | #302 | Tragic $84,384 |
| Hondurans | 0.0 /100 | #303 | Tragic $84,079 |
| Ottawa | 0.0 /100 | #304 | Tragic $83,953 |
| Chippewa | 0.0 /100 | #305 | Tragic $83,943 |
| Ute | 0.0 /100 | #306 | Tragic $83,937 |
| Shoshone | 0.0 /100 | #307 | Tragic $83,588 |
| Immigrants | Cabo Verde | 0.0 /100 | #308 | Tragic $83,542 |
| Immigrants | Dominica | 0.0 /100 | #309 | Tragic $83,311 |
| Immigrants | Haiti | 0.0 /100 | #310 | Tragic $83,257 |
| Immigrants | Bahamas | 0.0 /100 | #311 | Tragic $83,177 |
| Cajuns | 0.0 /100 | #312 | Tragic $83,015 |
| U.S. Virgin Islanders | 0.0 /100 | #313 | Tragic $82,736 |
| Immigrants | Honduras | 0.0 /100 | #314 | Tragic $82,697 |