French Canadian vs Panamanian Householder Income Ages 45 - 64 years
COMPARE
French Canadian
Panamanian
Householder Income Ages 45 - 64 years
Householder Income Ages 45 - 64 years Comparison
French Canadians
Panamanians
$99,093
HOUSEHOLDER INCOME AGES 45 - 64 YEARS
35.1/ 100
METRIC RATING
190th/ 347
METRIC RANK
$96,066
HOUSEHOLDER INCOME AGES 45 - 64 YEARS
10.6/ 100
METRIC RATING
214th/ 347
METRIC RANK
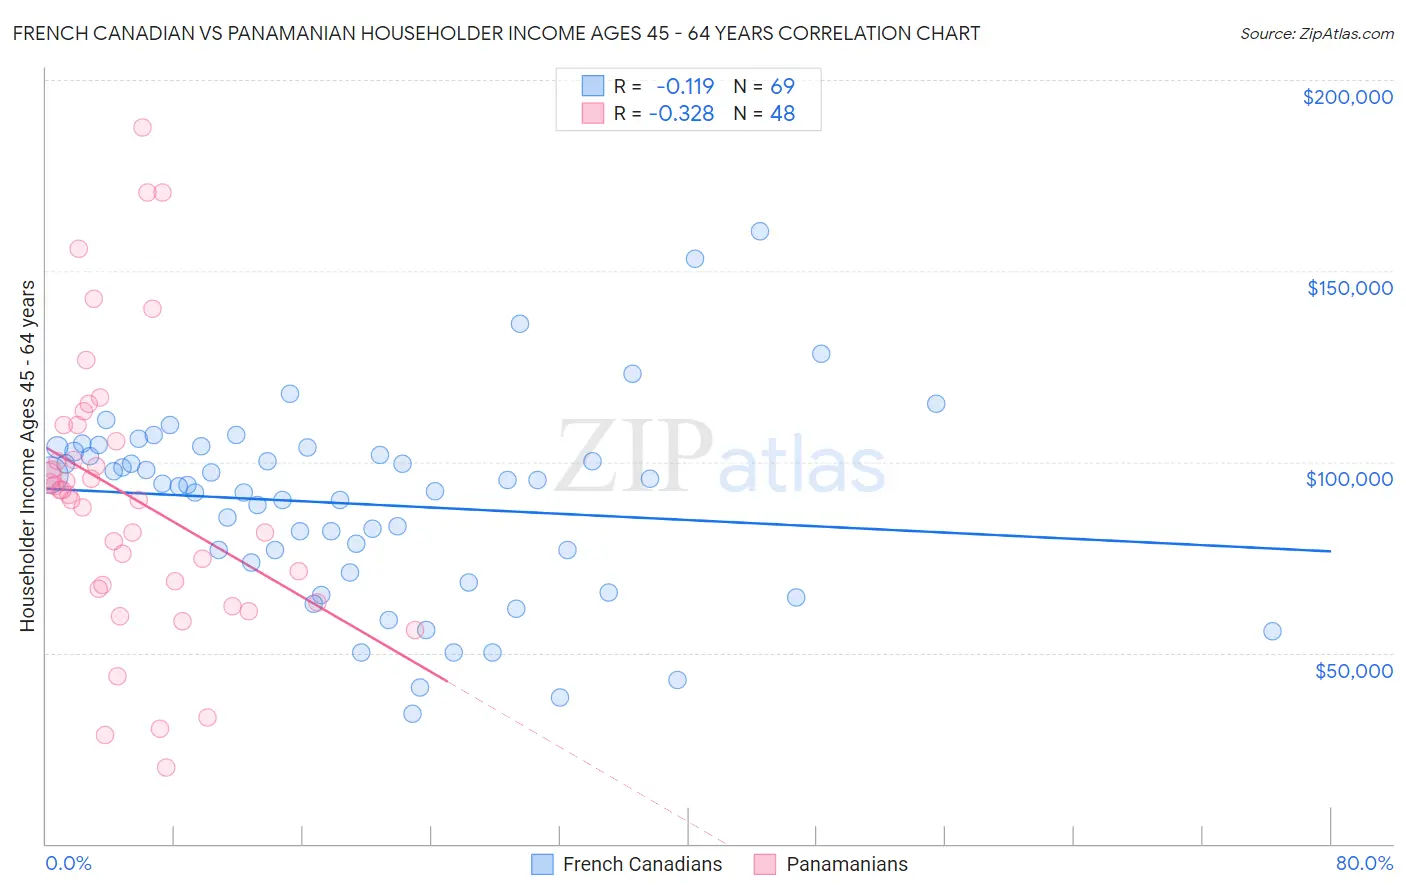
French Canadian vs Panamanian Householder Income Ages 45 - 64 years Correlation Chart
The statistical analysis conducted on geographies consisting of 500,903,469 people shows a poor negative correlation between the proportion of French Canadians and household income with householder between the ages 45 and 64 in the United States with a correlation coefficient (R) of -0.119 and weighted average of $99,093. Similarly, the statistical analysis conducted on geographies consisting of 280,831,012 people shows a mild negative correlation between the proportion of Panamanians and household income with householder between the ages 45 and 64 in the United States with a correlation coefficient (R) of -0.328 and weighted average of $96,066, a difference of 3.2%.
Householder Income Ages 45 - 64 years Correlation Summary
| Measurement | French Canadian | Panamanian |
| Minimum | $33,899 | $19,813 |
| Maximum | $160,455 | $187,621 |
| Range | $126,556 | $167,808 |
| Mean | $88,921 | $90,923 |
| Median | $93,815 | $91,973 |
| Interquartile 25% (IQ1) | $72,379 | $67,292 |
| Interquartile 75% (IQ3) | $103,210 | $107,469 |
| Interquartile Range (IQR) | $30,831 | $40,176 |
| Standard Deviation (Sample) | $25,131 | $36,458 |
| Standard Deviation (Population) | $24,948 | $36,077 |
Similar Demographics by Householder Income Ages 45 - 64 years
Demographics Similar to French Canadians by Householder Income Ages 45 - 64 years
In terms of householder income ages 45 - 64 years, the demographic groups most similar to French Canadians are Immigrants from South America ($99,126, a difference of 0.030%), Immigrants from Portugal ($99,203, a difference of 0.11%), Kenyan ($98,970, a difference of 0.12%), Celtic ($98,896, a difference of 0.20%), and Iraqi ($99,387, a difference of 0.30%).
| Demographics | Rating | Rank | Householder Income Ages 45 - 64 years |
| Spaniards | 44.6 /100 | #183 | Average $99,889 |
| French | 43.8 /100 | #184 | Average $99,824 |
| Colombians | 43.2 /100 | #185 | Average $99,772 |
| Dutch | 41.7 /100 | #186 | Average $99,650 |
| Iraqis | 38.5 /100 | #187 | Fair $99,387 |
| Immigrants | Portugal | 36.3 /100 | #188 | Fair $99,203 |
| Immigrants | South America | 35.4 /100 | #189 | Fair $99,126 |
| French Canadians | 35.1 /100 | #190 | Fair $99,093 |
| Kenyans | 33.7 /100 | #191 | Fair $98,970 |
| Celtics | 32.9 /100 | #192 | Fair $98,896 |
| Hawaiians | 31.6 /100 | #193 | Fair $98,778 |
| Uruguayans | 30.3 /100 | #194 | Fair $98,660 |
| Spanish | 29.2 /100 | #195 | Fair $98,554 |
| Immigrants | Eastern Africa | 28.3 /100 | #196 | Fair $98,467 |
| Puget Sound Salish | 27.0 /100 | #197 | Fair $98,340 |
Demographics Similar to Panamanians by Householder Income Ages 45 - 64 years
In terms of householder income ages 45 - 64 years, the demographic groups most similar to Panamanians are Immigrants from Uruguay ($96,086, a difference of 0.020%), Venezuelan ($96,460, a difference of 0.41%), Immigrants from Cambodia ($96,537, a difference of 0.49%), Nigerian ($95,492, a difference of 0.60%), and Tsimshian ($96,783, a difference of 0.75%).
| Demographics | Rating | Rank | Householder Income Ages 45 - 64 years |
| Ghanaians | 17.9 /100 | #207 | Poor $97,277 |
| Scotch-Irish | 16.4 /100 | #208 | Poor $97,073 |
| Japanese | 14.8 /100 | #209 | Poor $96,834 |
| Tsimshian | 14.5 /100 | #210 | Poor $96,783 |
| Immigrants | Cambodia | 13.0 /100 | #211 | Poor $96,537 |
| Venezuelans | 12.6 /100 | #212 | Poor $96,460 |
| Immigrants | Uruguay | 10.7 /100 | #213 | Poor $96,086 |
| Panamanians | 10.6 /100 | #214 | Poor $96,066 |
| Nigerians | 8.2 /100 | #215 | Tragic $95,492 |
| Immigrants | Venezuela | 7.6 /100 | #216 | Tragic $95,342 |
| Immigrants | Ghana | 6.4 /100 | #217 | Tragic $94,982 |
| Delaware | 6.2 /100 | #218 | Tragic $94,914 |
| Immigrants | Armenia | 6.1 /100 | #219 | Tragic $94,863 |
| Salvadorans | 6.0 /100 | #220 | Tragic $94,842 |
| Immigrants | Nigeria | 5.9 /100 | #221 | Tragic $94,804 |