Immigrants from Belarus vs Scandinavian Householder Income Ages 45 - 64 years
COMPARE
Immigrants from Belarus
Scandinavian
Householder Income Ages 45 - 64 years
Householder Income Ages 45 - 64 years Comparison
Immigrants from Belarus
Scandinavians
$111,430
HOUSEHOLDER INCOME AGES 45 - 64 YEARS
99.6/ 100
METRIC RATING
65th/ 347
METRIC RANK
$102,969
HOUSEHOLDER INCOME AGES 45 - 64 YEARS
79.0/ 100
METRIC RATING
153rd/ 347
METRIC RANK
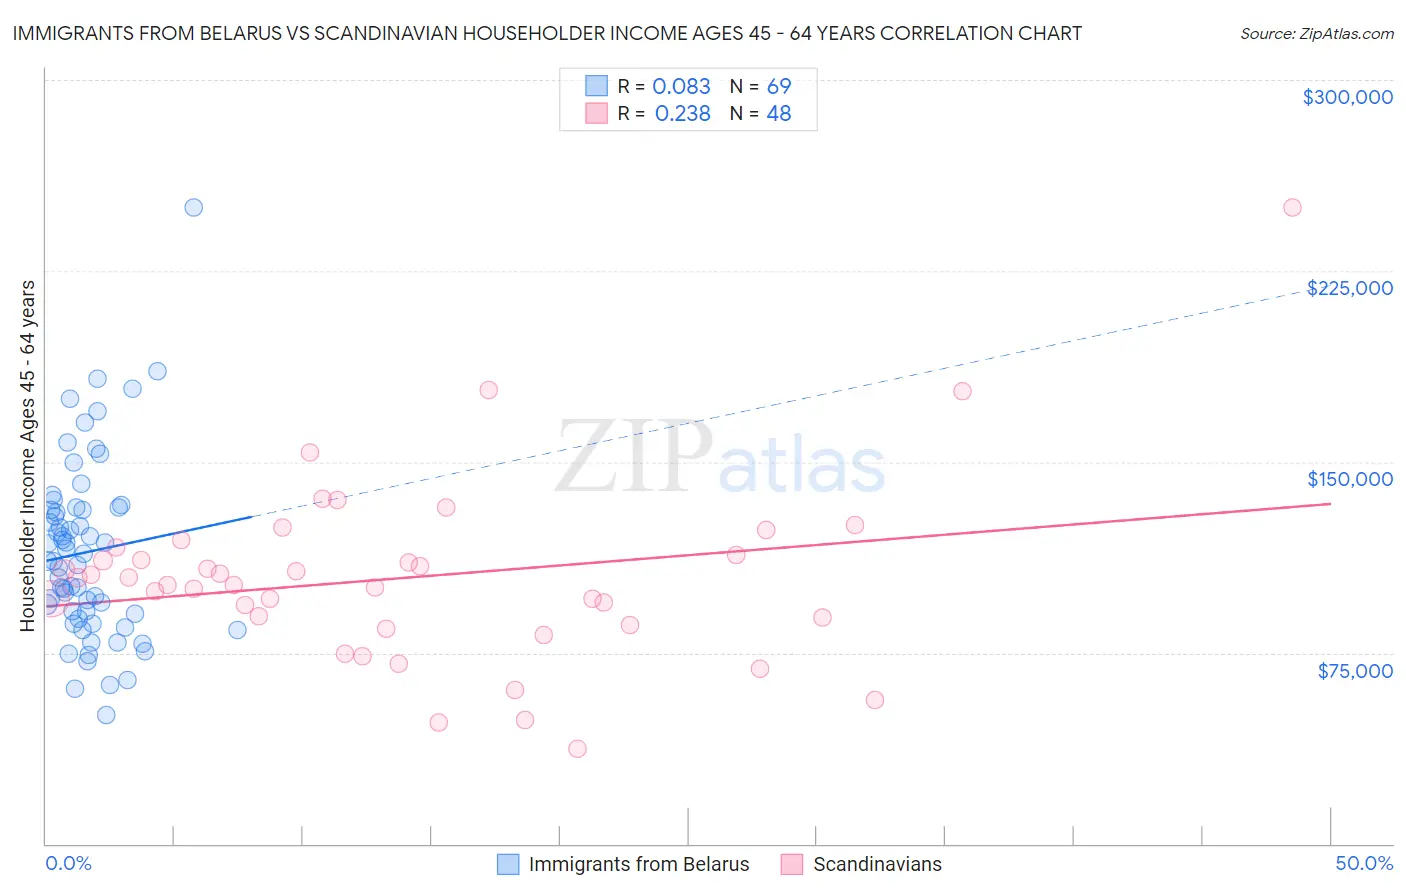
Immigrants from Belarus vs Scandinavian Householder Income Ages 45 - 64 years Correlation Chart
The statistical analysis conducted on geographies consisting of 150,153,617 people shows a slight positive correlation between the proportion of Immigrants from Belarus and household income with householder between the ages 45 and 64 in the United States with a correlation coefficient (R) of 0.083 and weighted average of $111,430. Similarly, the statistical analysis conducted on geographies consisting of 471,257,536 people shows a weak positive correlation between the proportion of Scandinavians and household income with householder between the ages 45 and 64 in the United States with a correlation coefficient (R) of 0.238 and weighted average of $102,969, a difference of 8.2%.
Householder Income Ages 45 - 64 years Correlation Summary
| Measurement | Immigrants from Belarus | Scandinavian |
| Minimum | $50,645 | $37,396 |
| Maximum | $250,001 | $250,001 |
| Range | $199,356 | $212,605 |
| Mean | $114,531 | $104,566 |
| Median | $110,936 | $103,110 |
| Interquartile 25% (IQ1) | $89,337 | $87,340 |
| Interquartile 75% (IQ3) | $131,465 | $114,988 |
| Interquartile Range (IQR) | $42,127 | $27,648 |
| Standard Deviation (Sample) | $35,174 | $35,851 |
| Standard Deviation (Population) | $34,918 | $35,476 |
Similar Demographics by Householder Income Ages 45 - 64 years
Demographics Similar to Immigrants from Belarus by Householder Income Ages 45 - 64 years
In terms of householder income ages 45 - 64 years, the demographic groups most similar to Immigrants from Belarus are Immigrants from Latvia ($111,454, a difference of 0.020%), New Zealander ($111,286, a difference of 0.13%), Mongolian ($111,602, a difference of 0.15%), Immigrants from Norway ($111,669, a difference of 0.21%), and Laotian ($111,051, a difference of 0.34%).
| Demographics | Rating | Rank | Householder Income Ages 45 - 64 years |
| Soviet Union | 99.7 /100 | #58 | Exceptional $112,008 |
| Immigrants | Europe | 99.7 /100 | #59 | Exceptional $111,984 |
| Immigrants | Netherlands | 99.7 /100 | #60 | Exceptional $111,982 |
| Immigrants | Czechoslovakia | 99.7 /100 | #61 | Exceptional $111,914 |
| Immigrants | Norway | 99.7 /100 | #62 | Exceptional $111,669 |
| Mongolians | 99.6 /100 | #63 | Exceptional $111,602 |
| Immigrants | Latvia | 99.6 /100 | #64 | Exceptional $111,454 |
| Immigrants | Belarus | 99.6 /100 | #65 | Exceptional $111,430 |
| New Zealanders | 99.6 /100 | #66 | Exceptional $111,286 |
| Laotians | 99.5 /100 | #67 | Exceptional $111,051 |
| Immigrants | Romania | 99.4 /100 | #68 | Exceptional $110,633 |
| Immigrants | Italy | 99.4 /100 | #69 | Exceptional $110,434 |
| Koreans | 99.3 /100 | #70 | Exceptional $110,334 |
| Italians | 99.3 /100 | #71 | Exceptional $110,224 |
| Assyrians/Chaldeans/Syriacs | 99.3 /100 | #72 | Exceptional $110,201 |
Demographics Similar to Scandinavians by Householder Income Ages 45 - 64 years
In terms of householder income ages 45 - 64 years, the demographic groups most similar to Scandinavians are Slovene ($102,885, a difference of 0.080%), Irish ($103,067, a difference of 0.090%), Swiss ($103,071, a difference of 0.10%), Costa Rican ($102,779, a difference of 0.19%), and Carpatho Rusyn ($102,777, a difference of 0.19%).
| Demographics | Rating | Rank | Householder Income Ages 45 - 64 years |
| Immigrants | Chile | 82.5 /100 | #146 | Excellent $103,412 |
| Basques | 82.3 /100 | #147 | Excellent $103,387 |
| Immigrants | Germany | 81.5 /100 | #148 | Excellent $103,282 |
| Immigrants | Sierra Leone | 81.1 /100 | #149 | Excellent $103,227 |
| Immigrants | Peru | 80.7 /100 | #150 | Excellent $103,173 |
| Swiss | 79.9 /100 | #151 | Good $103,071 |
| Irish | 79.8 /100 | #152 | Good $103,067 |
| Scandinavians | 79.0 /100 | #153 | Good $102,969 |
| Slovenes | 78.3 /100 | #154 | Good $102,885 |
| Costa Ricans | 77.4 /100 | #155 | Good $102,779 |
| Carpatho Rusyns | 77.4 /100 | #156 | Good $102,777 |
| Immigrants | Ethiopia | 77.3 /100 | #157 | Good $102,763 |
| Slavs | 76.1 /100 | #158 | Good $102,629 |
| Sierra Leoneans | 74.2 /100 | #159 | Good $102,427 |
| Icelanders | 72.5 /100 | #160 | Good $102,261 |