Ugandan vs Jordanian Median Female Earnings
COMPARE
Ugandan
Jordanian
Median Female Earnings
Median Female Earnings Comparison
Ugandans
Jordanians
$40,889
MEDIAN FEMALE EARNINGS
92.2/ 100
METRIC RATING
127th/ 347
METRIC RANK
$41,464
MEDIAN FEMALE EARNINGS
97.5/ 100
METRIC RATING
108th/ 347
METRIC RANK
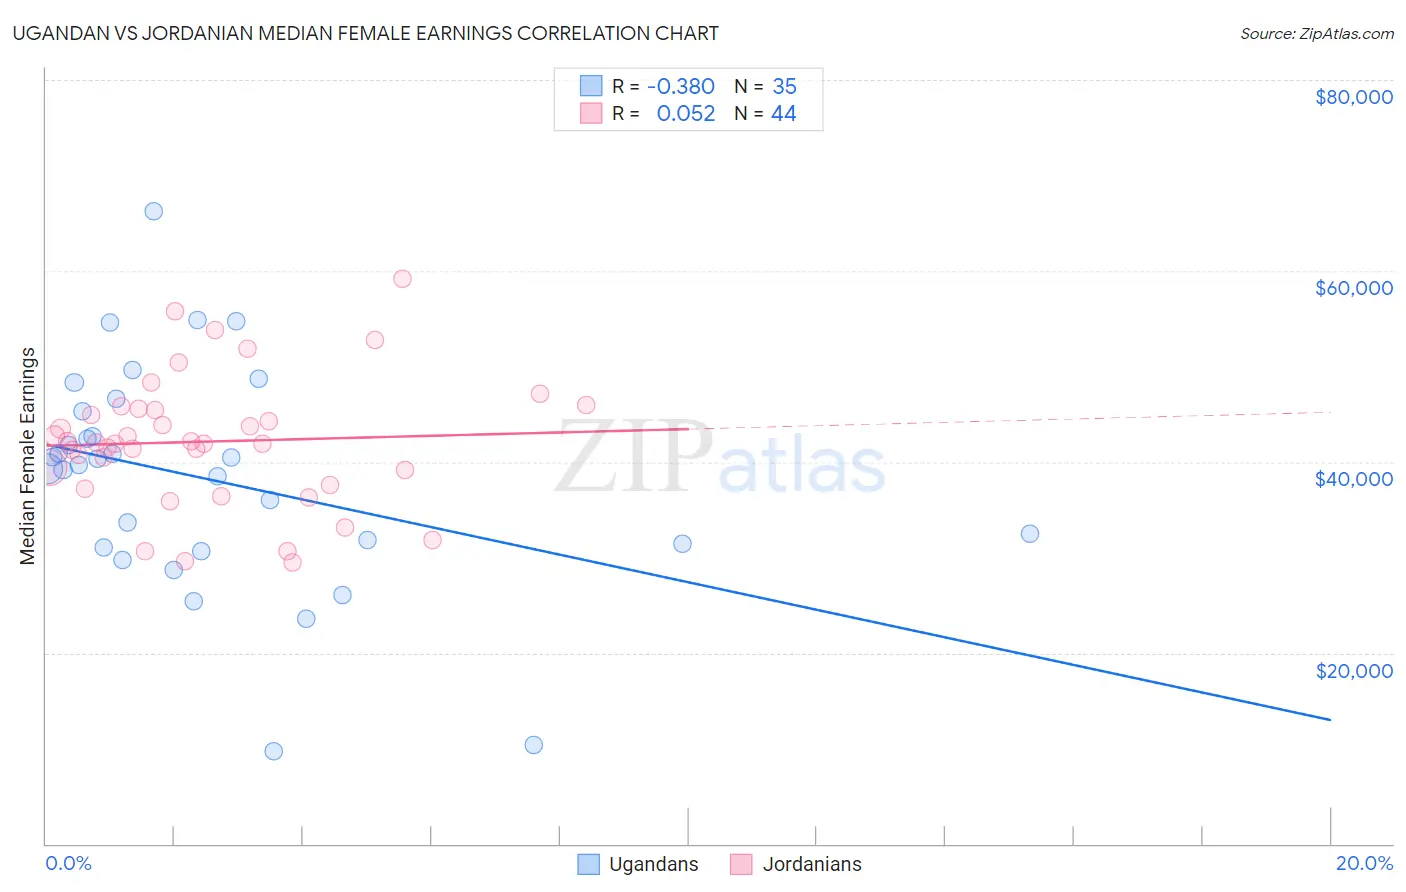
Ugandan vs Jordanian Median Female Earnings Correlation Chart
The statistical analysis conducted on geographies consisting of 94,007,517 people shows a mild negative correlation between the proportion of Ugandans and median female earnings in the United States with a correlation coefficient (R) of -0.380 and weighted average of $40,889. Similarly, the statistical analysis conducted on geographies consisting of 166,394,093 people shows a slight positive correlation between the proportion of Jordanians and median female earnings in the United States with a correlation coefficient (R) of 0.052 and weighted average of $41,464, a difference of 1.4%.
Median Female Earnings Correlation Summary
| Measurement | Ugandan | Jordanian |
| Minimum | $9,732 | $29,450 |
| Maximum | $66,250 | $59,183 |
| Range | $56,518 | $29,733 |
| Mean | $38,170 | $42,125 |
| Median | $39,623 | $41,963 |
| Interquartile 25% (IQ1) | $31,024 | $38,328 |
| Interquartile 75% (IQ3) | $45,270 | $45,509 |
| Interquartile Range (IQR) | $14,246 | $7,181 |
| Standard Deviation (Sample) | $11,739 | $6,763 |
| Standard Deviation (Population) | $11,570 | $6,685 |
Demographics Similar to Ugandans and Jordanians by Median Female Earnings
In terms of median female earnings, the demographic groups most similar to Ugandans are Immigrants from Trinidad and Tobago ($40,895, a difference of 0.020%), Austrian ($40,923, a difference of 0.080%), Trinidadian and Tobagonian ($40,958, a difference of 0.17%), Guyanese ($40,973, a difference of 0.21%), and Immigrants from Jordan ($40,977, a difference of 0.22%). Similarly, the demographic groups most similar to Jordanians are Chinese ($41,461, a difference of 0.010%), Palestinian ($41,484, a difference of 0.050%), Immigrants from Western Asia ($41,375, a difference of 0.22%), Immigrants from Canada ($41,373, a difference of 0.22%), and Immigrants from North America ($41,319, a difference of 0.35%).
| Demographics | Rating | Rank | Median Female Earnings |
| Palestinians | 97.6 /100 | #107 | Exceptional $41,484 |
| Jordanians | 97.5 /100 | #108 | Exceptional $41,464 |
| Chinese | 97.5 /100 | #109 | Exceptional $41,461 |
| Immigrants | Western Asia | 97.0 /100 | #110 | Exceptional $41,375 |
| Immigrants | Canada | 97.0 /100 | #111 | Exceptional $41,373 |
| Immigrants | North America | 96.7 /100 | #112 | Exceptional $41,319 |
| Macedonians | 96.4 /100 | #113 | Exceptional $41,286 |
| Immigrants | England | 96.4 /100 | #114 | Exceptional $41,277 |
| Koreans | 96.4 /100 | #115 | Exceptional $41,276 |
| Immigrants | Brazil | 96.4 /100 | #116 | Exceptional $41,273 |
| Barbadians | 96.3 /100 | #117 | Exceptional $41,261 |
| Immigrants | Lebanon | 95.6 /100 | #118 | Exceptional $41,183 |
| Immigrants | Philippines | 95.0 /100 | #119 | Exceptional $41,114 |
| Immigrants | Kuwait | 94.4 /100 | #120 | Exceptional $41,055 |
| Croatians | 93.7 /100 | #121 | Exceptional $40,993 |
| Immigrants | Jordan | 93.5 /100 | #122 | Exceptional $40,977 |
| Guyanese | 93.4 /100 | #123 | Exceptional $40,973 |
| Trinidadians and Tobagonians | 93.2 /100 | #124 | Exceptional $40,958 |
| Austrians | 92.7 /100 | #125 | Exceptional $40,923 |
| Immigrants | Trinidad and Tobago | 92.3 /100 | #126 | Exceptional $40,895 |
| Ugandans | 92.2 /100 | #127 | Exceptional $40,889 |