Immigrants from Malaysia vs Jordanian Median Female Earnings
COMPARE
Immigrants from Malaysia
Jordanian
Median Female Earnings
Median Female Earnings Comparison
Immigrants from Malaysia
Jordanians
$43,835
MEDIAN FEMALE EARNINGS
100.0/ 100
METRIC RATING
40th/ 347
METRIC RANK
$41,464
MEDIAN FEMALE EARNINGS
97.5/ 100
METRIC RATING
108th/ 347
METRIC RANK
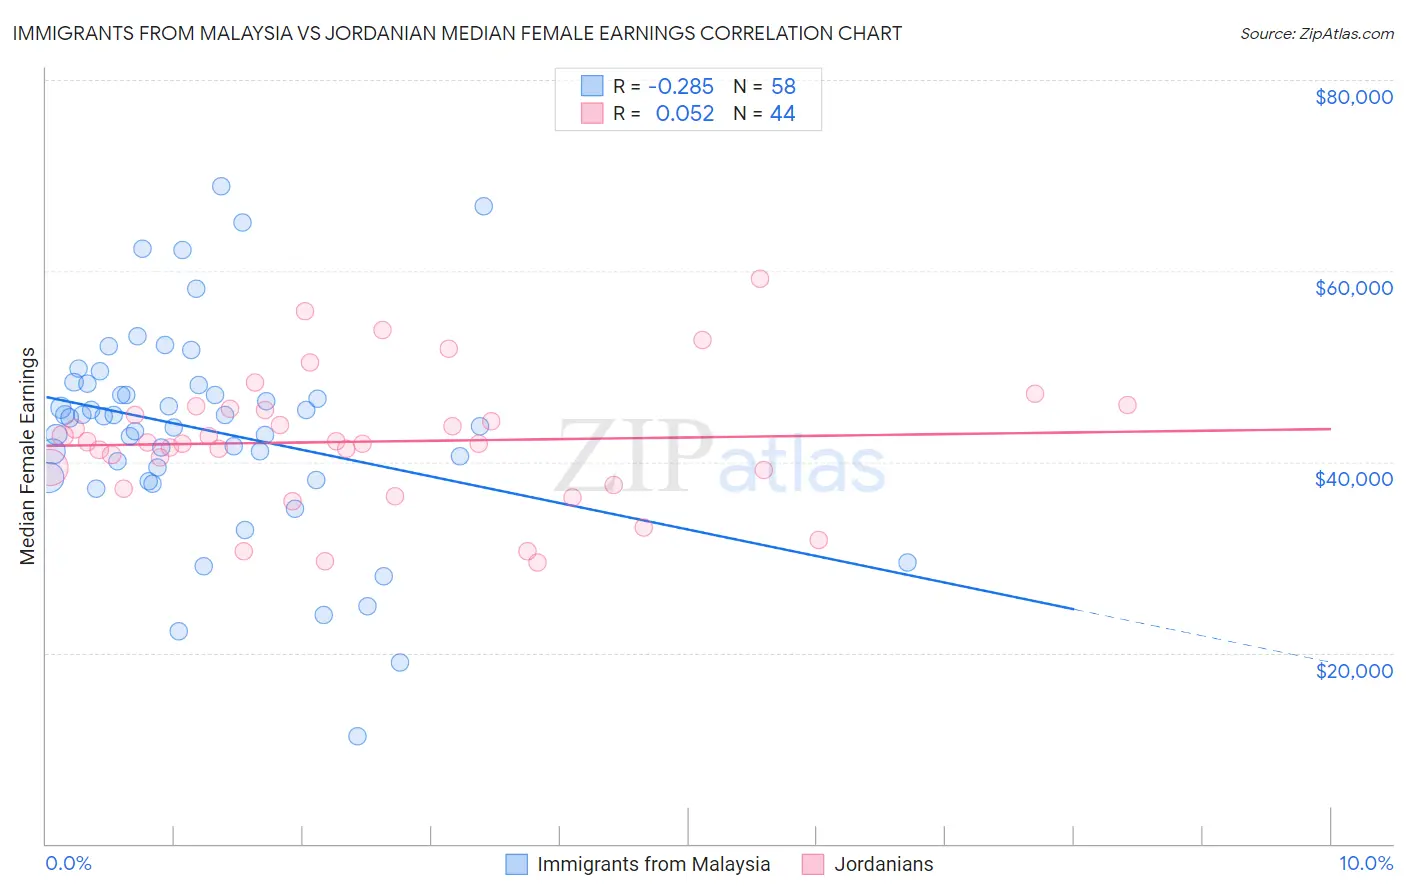
Immigrants from Malaysia vs Jordanian Median Female Earnings Correlation Chart
The statistical analysis conducted on geographies consisting of 197,943,431 people shows a weak negative correlation between the proportion of Immigrants from Malaysia and median female earnings in the United States with a correlation coefficient (R) of -0.285 and weighted average of $43,835. Similarly, the statistical analysis conducted on geographies consisting of 166,394,093 people shows a slight positive correlation between the proportion of Jordanians and median female earnings in the United States with a correlation coefficient (R) of 0.052 and weighted average of $41,464, a difference of 5.7%.
Median Female Earnings Correlation Summary
| Measurement | Immigrants from Malaysia | Jordanian |
| Minimum | $11,250 | $29,450 |
| Maximum | $68,919 | $59,183 |
| Range | $57,669 | $29,733 |
| Mean | $43,300 | $42,125 |
| Median | $44,670 | $41,963 |
| Interquartile 25% (IQ1) | $38,363 | $38,328 |
| Interquartile 75% (IQ3) | $48,104 | $45,509 |
| Interquartile Range (IQR) | $9,741 | $7,181 |
| Standard Deviation (Sample) | $11,057 | $6,763 |
| Standard Deviation (Population) | $10,961 | $6,685 |
Similar Demographics by Median Female Earnings
Demographics Similar to Immigrants from Malaysia by Median Female Earnings
In terms of median female earnings, the demographic groups most similar to Immigrants from Malaysia are Israeli ($43,852, a difference of 0.040%), Latvian ($43,941, a difference of 0.24%), Immigrants from Switzerland ($43,996, a difference of 0.37%), Bhutanese ($43,648, a difference of 0.43%), and Immigrants from Denmark ($43,646, a difference of 0.43%).
| Demographics | Rating | Rank | Median Female Earnings |
| Immigrants | Asia | 100.0 /100 | #33 | Exceptional $44,198 |
| Russians | 100.0 /100 | #34 | Exceptional $44,169 |
| Immigrants | Sri Lanka | 100.0 /100 | #35 | Exceptional $44,161 |
| Immigrants | Turkey | 100.0 /100 | #36 | Exceptional $44,066 |
| Immigrants | Switzerland | 100.0 /100 | #37 | Exceptional $43,996 |
| Latvians | 100.0 /100 | #38 | Exceptional $43,941 |
| Israelis | 100.0 /100 | #39 | Exceptional $43,852 |
| Immigrants | Malaysia | 100.0 /100 | #40 | Exceptional $43,835 |
| Bhutanese | 100.0 /100 | #41 | Exceptional $43,648 |
| Immigrants | Denmark | 100.0 /100 | #42 | Exceptional $43,646 |
| Bulgarians | 100.0 /100 | #43 | Exceptional $43,638 |
| Immigrants | Czechoslovakia | 100.0 /100 | #44 | Exceptional $43,571 |
| Immigrants | Europe | 100.0 /100 | #45 | Exceptional $43,523 |
| Immigrants | Bolivia | 100.0 /100 | #46 | Exceptional $43,467 |
| Bolivians | 100.0 /100 | #47 | Exceptional $43,445 |
Demographics Similar to Jordanians by Median Female Earnings
In terms of median female earnings, the demographic groups most similar to Jordanians are Chinese ($41,461, a difference of 0.010%), Immigrants from Eritrea ($41,485, a difference of 0.050%), Palestinian ($41,484, a difference of 0.050%), Italian ($41,505, a difference of 0.10%), and Immigrants from Zimbabwe ($41,527, a difference of 0.15%).
| Demographics | Rating | Rank | Median Female Earnings |
| Immigrants | Fiji | 98.3 /100 | #101 | Exceptional $41,656 |
| Immigrants | Poland | 98.2 /100 | #102 | Exceptional $41,630 |
| Immigrants | Argentina | 97.9 /100 | #103 | Exceptional $41,554 |
| Immigrants | Zimbabwe | 97.8 /100 | #104 | Exceptional $41,527 |
| Italians | 97.7 /100 | #105 | Exceptional $41,505 |
| Immigrants | Eritrea | 97.6 /100 | #106 | Exceptional $41,485 |
| Palestinians | 97.6 /100 | #107 | Exceptional $41,484 |
| Jordanians | 97.5 /100 | #108 | Exceptional $41,464 |
| Chinese | 97.5 /100 | #109 | Exceptional $41,461 |
| Immigrants | Western Asia | 97.0 /100 | #110 | Exceptional $41,375 |
| Immigrants | Canada | 97.0 /100 | #111 | Exceptional $41,373 |
| Immigrants | North America | 96.7 /100 | #112 | Exceptional $41,319 |
| Macedonians | 96.4 /100 | #113 | Exceptional $41,286 |
| Immigrants | England | 96.4 /100 | #114 | Exceptional $41,277 |
| Koreans | 96.4 /100 | #115 | Exceptional $41,276 |