Immigrants from Trinidad and Tobago vs Jordanian Median Female Earnings
COMPARE
Immigrants from Trinidad and Tobago
Jordanian
Median Female Earnings
Median Female Earnings Comparison
Immigrants from Trinidad and Tobago
Jordanians
$40,895
MEDIAN FEMALE EARNINGS
92.3/ 100
METRIC RATING
126th/ 347
METRIC RANK
$41,464
MEDIAN FEMALE EARNINGS
97.5/ 100
METRIC RATING
108th/ 347
METRIC RANK
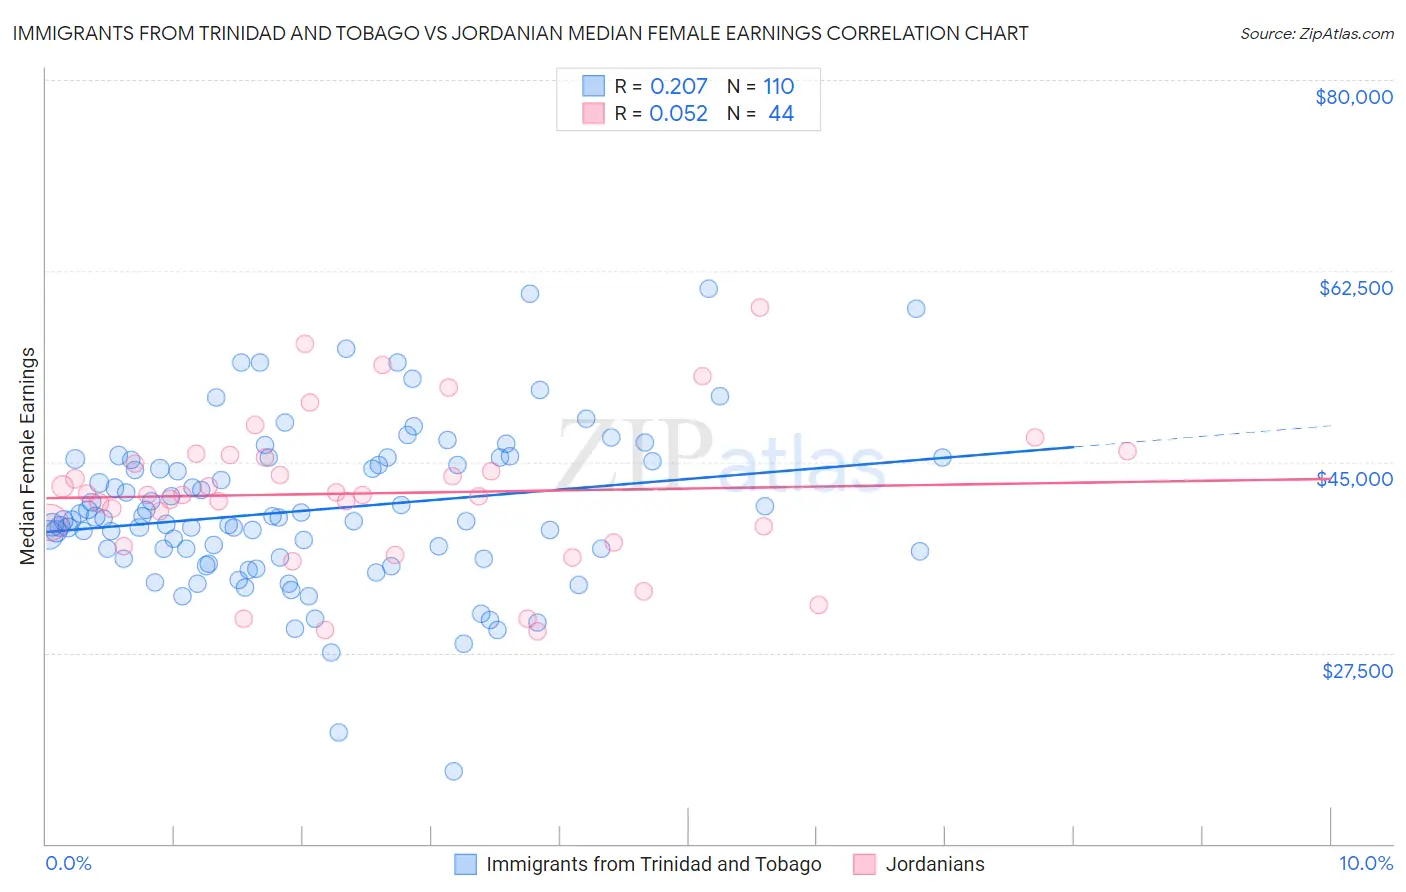
Immigrants from Trinidad and Tobago vs Jordanian Median Female Earnings Correlation Chart
The statistical analysis conducted on geographies consisting of 223,490,788 people shows a weak positive correlation between the proportion of Immigrants from Trinidad and Tobago and median female earnings in the United States with a correlation coefficient (R) of 0.207 and weighted average of $40,895. Similarly, the statistical analysis conducted on geographies consisting of 166,394,093 people shows a slight positive correlation between the proportion of Jordanians and median female earnings in the United States with a correlation coefficient (R) of 0.052 and weighted average of $41,464, a difference of 1.4%.
Median Female Earnings Correlation Summary
| Measurement | Immigrants from Trinidad and Tobago | Jordanian |
| Minimum | $16,600 | $29,450 |
| Maximum | $60,818 | $59,183 |
| Range | $44,218 | $29,733 |
| Mean | $40,591 | $42,125 |
| Median | $39,706 | $41,963 |
| Interquartile 25% (IQ1) | $36,241 | $38,328 |
| Interquartile 75% (IQ3) | $45,207 | $45,509 |
| Interquartile Range (IQR) | $8,965 | $7,181 |
| Standard Deviation (Sample) | $7,375 | $6,763 |
| Standard Deviation (Population) | $7,342 | $6,685 |
Demographics Similar to Immigrants from Trinidad and Tobago and Jordanians by Median Female Earnings
In terms of median female earnings, the demographic groups most similar to Immigrants from Trinidad and Tobago are Ugandan ($40,889, a difference of 0.020%), Austrian ($40,923, a difference of 0.070%), Trinidadian and Tobagonian ($40,958, a difference of 0.15%), Guyanese ($40,973, a difference of 0.19%), and Immigrants from Jordan ($40,977, a difference of 0.20%). Similarly, the demographic groups most similar to Jordanians are Chinese ($41,461, a difference of 0.010%), Palestinian ($41,484, a difference of 0.050%), Immigrants from Western Asia ($41,375, a difference of 0.22%), Immigrants from Canada ($41,373, a difference of 0.22%), and Immigrants from North America ($41,319, a difference of 0.35%).
| Demographics | Rating | Rank | Median Female Earnings |
| Palestinians | 97.6 /100 | #107 | Exceptional $41,484 |
| Jordanians | 97.5 /100 | #108 | Exceptional $41,464 |
| Chinese | 97.5 /100 | #109 | Exceptional $41,461 |
| Immigrants | Western Asia | 97.0 /100 | #110 | Exceptional $41,375 |
| Immigrants | Canada | 97.0 /100 | #111 | Exceptional $41,373 |
| Immigrants | North America | 96.7 /100 | #112 | Exceptional $41,319 |
| Macedonians | 96.4 /100 | #113 | Exceptional $41,286 |
| Immigrants | England | 96.4 /100 | #114 | Exceptional $41,277 |
| Koreans | 96.4 /100 | #115 | Exceptional $41,276 |
| Immigrants | Brazil | 96.4 /100 | #116 | Exceptional $41,273 |
| Barbadians | 96.3 /100 | #117 | Exceptional $41,261 |
| Immigrants | Lebanon | 95.6 /100 | #118 | Exceptional $41,183 |
| Immigrants | Philippines | 95.0 /100 | #119 | Exceptional $41,114 |
| Immigrants | Kuwait | 94.4 /100 | #120 | Exceptional $41,055 |
| Croatians | 93.7 /100 | #121 | Exceptional $40,993 |
| Immigrants | Jordan | 93.5 /100 | #122 | Exceptional $40,977 |
| Guyanese | 93.4 /100 | #123 | Exceptional $40,973 |
| Trinidadians and Tobagonians | 93.2 /100 | #124 | Exceptional $40,958 |
| Austrians | 92.7 /100 | #125 | Exceptional $40,923 |
| Immigrants | Trinidad and Tobago | 92.3 /100 | #126 | Exceptional $40,895 |
| Ugandans | 92.2 /100 | #127 | Exceptional $40,889 |