French Canadian vs European Per Capita Income
COMPARE
French Canadian
European
Per Capita Income
Per Capita Income Comparison
French Canadians
Europeans
$43,003
PER CAPITA INCOME
32.3/ 100
METRIC RATING
186th/ 347
METRIC RANK
$45,836
PER CAPITA INCOME
92.0/ 100
METRIC RATING
124th/ 347
METRIC RANK
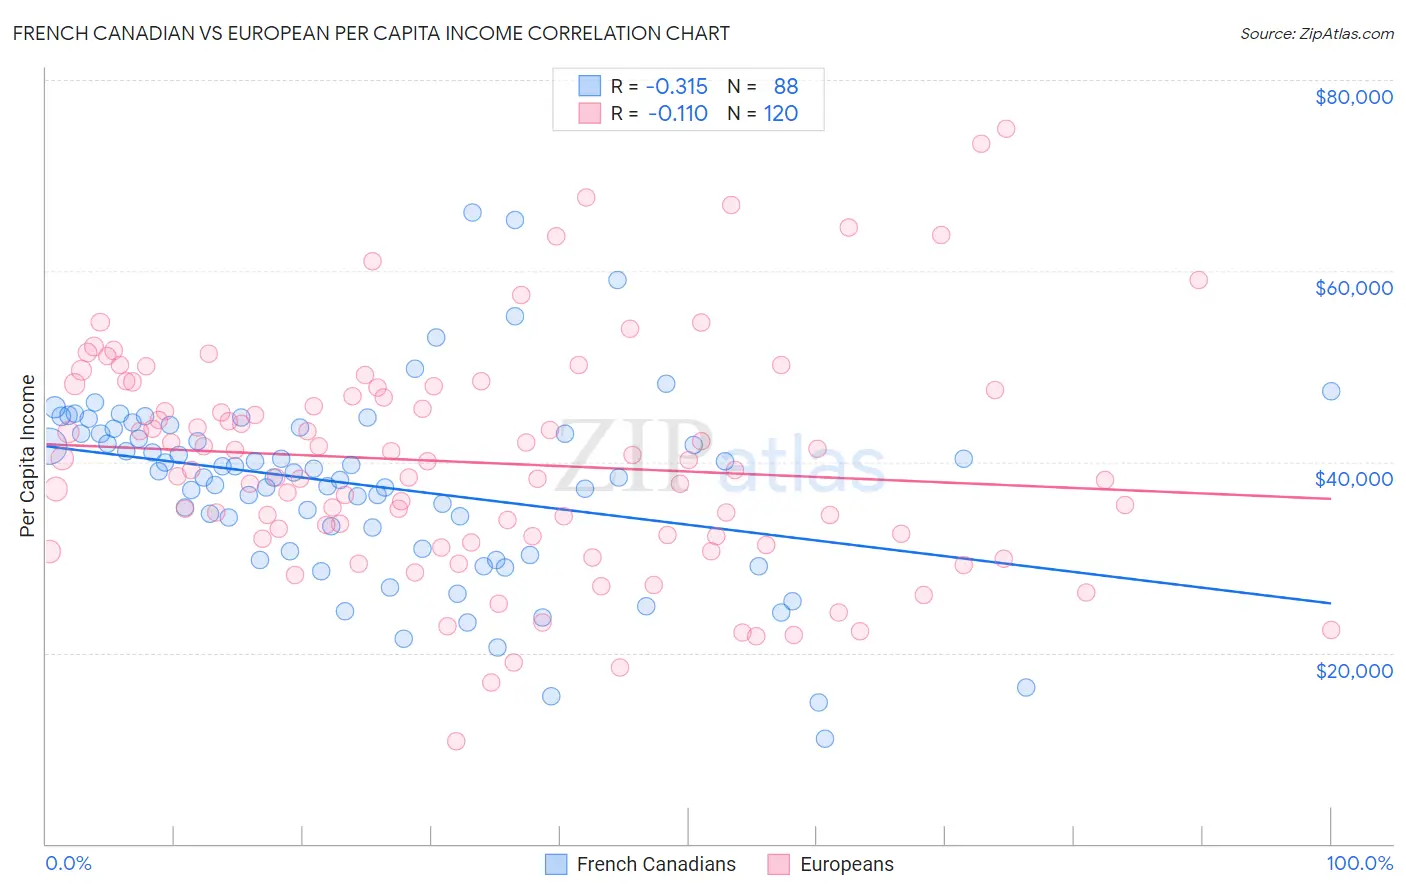
French Canadian vs European Per Capita Income Correlation Chart
The statistical analysis conducted on geographies consisting of 502,704,545 people shows a mild negative correlation between the proportion of French Canadians and per capita income in the United States with a correlation coefficient (R) of -0.315 and weighted average of $43,003. Similarly, the statistical analysis conducted on geographies consisting of 561,881,498 people shows a poor negative correlation between the proportion of Europeans and per capita income in the United States with a correlation coefficient (R) of -0.110 and weighted average of $45,836, a difference of 6.6%.
Per Capita Income Correlation Summary
| Measurement | French Canadian | European |
| Minimum | $10,964 | $10,710 |
| Maximum | $66,177 | $74,913 |
| Range | $55,213 | $64,203 |
| Mean | $37,443 | $39,928 |
| Median | $38,631 | $39,188 |
| Interquartile 25% (IQ1) | $30,758 | $32,091 |
| Interquartile 75% (IQ3) | $43,262 | $47,667 |
| Interquartile Range (IQR) | $12,504 | $15,576 |
| Standard Deviation (Sample) | $9,955 | $11,966 |
| Standard Deviation (Population) | $9,898 | $11,916 |
Similar Demographics by Per Capita Income
Demographics Similar to French Canadians by Per Capita Income
In terms of per capita income, the demographic groups most similar to French Canadians are Immigrants ($43,010, a difference of 0.020%), Spaniard ($43,028, a difference of 0.060%), Immigrants from Colombia ($42,971, a difference of 0.070%), Immigrants from Africa ($42,950, a difference of 0.12%), and German ($43,067, a difference of 0.15%).
| Demographics | Rating | Rank | Per Capita Income |
| Finns | 44.4 /100 | #179 | Average $43,461 |
| Sierra Leoneans | 42.9 /100 | #180 | Average $43,405 |
| Welsh | 38.2 /100 | #181 | Fair $43,233 |
| Immigrants | Vietnam | 38.1 /100 | #182 | Fair $43,229 |
| Germans | 33.9 /100 | #183 | Fair $43,067 |
| Spaniards | 32.9 /100 | #184 | Fair $43,028 |
| Immigrants | Immigrants | 32.5 /100 | #185 | Fair $43,010 |
| French Canadians | 32.3 /100 | #186 | Fair $43,003 |
| Immigrants | Colombia | 31.5 /100 | #187 | Fair $42,971 |
| Immigrants | Africa | 31.0 /100 | #188 | Fair $42,950 |
| Bermudans | 30.1 /100 | #189 | Fair $42,911 |
| Kenyans | 27.7 /100 | #190 | Fair $42,808 |
| Yugoslavians | 27.4 /100 | #191 | Fair $42,792 |
| Iraqis | 26.7 /100 | #192 | Fair $42,760 |
| Immigrants | Sierra Leone | 26.5 /100 | #193 | Fair $42,752 |
Demographics Similar to Europeans by Per Capita Income
In terms of per capita income, the demographic groups most similar to Europeans are Lebanese ($45,840, a difference of 0.010%), Moroccan ($45,854, a difference of 0.040%), Canadian ($45,858, a difference of 0.050%), Zimbabwean ($45,804, a difference of 0.070%), and Palestinian ($45,790, a difference of 0.10%).
| Demographics | Rating | Rank | Per Capita Income |
| Chinese | 93.9 /100 | #117 | Exceptional $46,098 |
| Immigrants | Saudi Arabia | 93.3 /100 | #118 | Exceptional $46,008 |
| Immigrants | Poland | 93.1 /100 | #119 | Exceptional $45,979 |
| Immigrants | Ethiopia | 92.7 /100 | #120 | Exceptional $45,923 |
| Canadians | 92.2 /100 | #121 | Exceptional $45,858 |
| Moroccans | 92.1 /100 | #122 | Exceptional $45,854 |
| Lebanese | 92.0 /100 | #123 | Exceptional $45,840 |
| Europeans | 92.0 /100 | #124 | Exceptional $45,836 |
| Zimbabweans | 91.7 /100 | #125 | Exceptional $45,804 |
| Palestinians | 91.6 /100 | #126 | Exceptional $45,790 |
| Immigrants | Germany | 91.3 /100 | #127 | Exceptional $45,751 |
| Swedes | 91.3 /100 | #128 | Exceptional $45,750 |
| Luxembourgers | 90.4 /100 | #129 | Exceptional $45,663 |
| Arabs | 90.4 /100 | #130 | Exceptional $45,662 |
| Immigrants | North Macedonia | 90.0 /100 | #131 | Exceptional $45,622 |