French Canadian vs Immigrants from South America Per Capita Income
COMPARE
French Canadian
Immigrants from South America
Per Capita Income
Per Capita Income Comparison
French Canadians
Immigrants from South America
$43,003
PER CAPITA INCOME
32.3/ 100
METRIC RATING
186th/ 347
METRIC RANK
$44,068
PER CAPITA INCOME
61.2/ 100
METRIC RATING
163rd/ 347
METRIC RANK
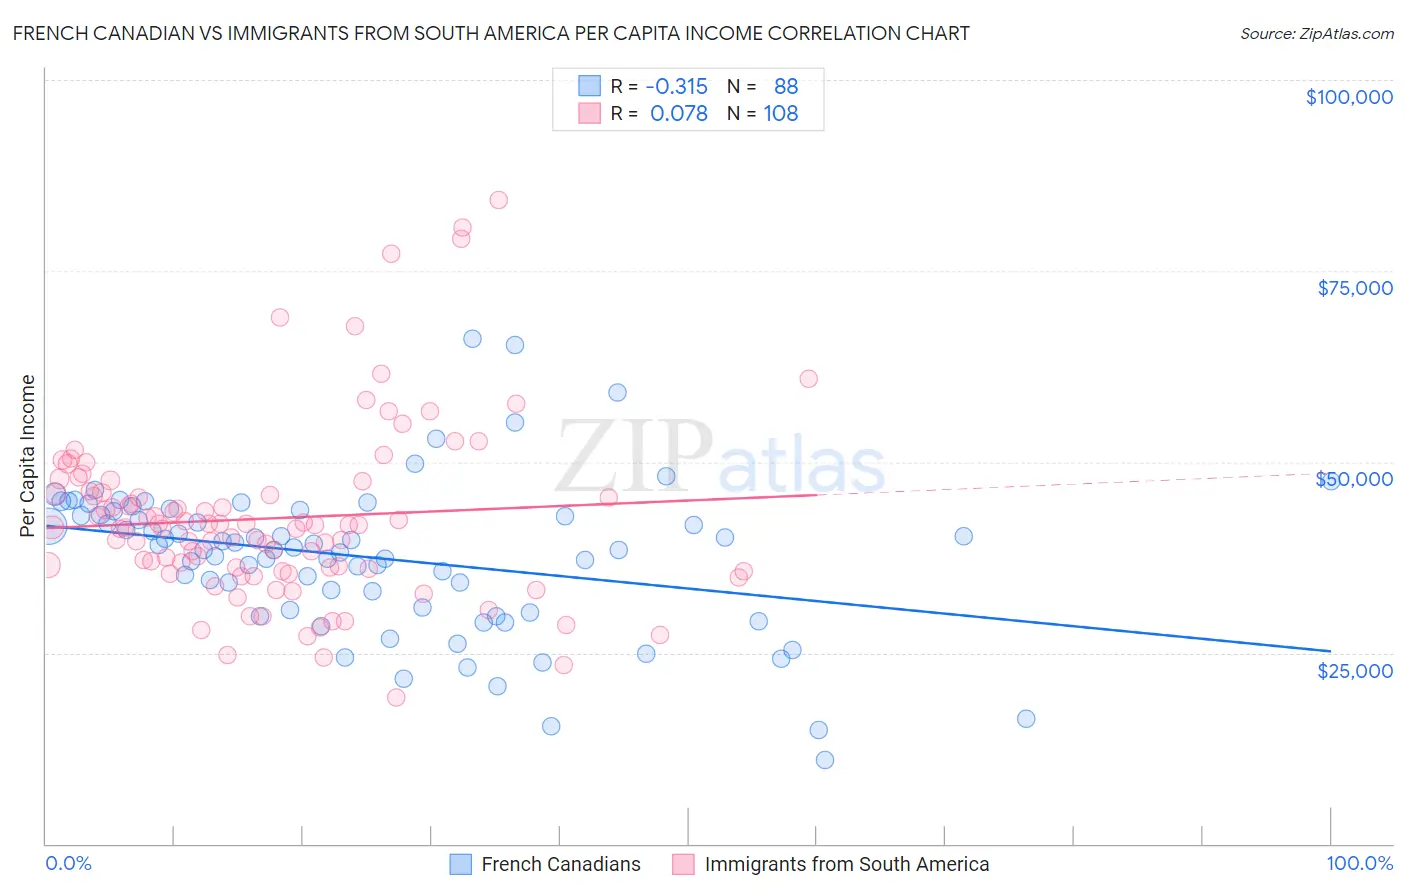
French Canadian vs Immigrants from South America Per Capita Income Correlation Chart
The statistical analysis conducted on geographies consisting of 502,704,545 people shows a mild negative correlation between the proportion of French Canadians and per capita income in the United States with a correlation coefficient (R) of -0.315 and weighted average of $43,003. Similarly, the statistical analysis conducted on geographies consisting of 486,454,612 people shows a slight positive correlation between the proportion of Immigrants from South America and per capita income in the United States with a correlation coefficient (R) of 0.078 and weighted average of $44,068, a difference of 2.5%.
Per Capita Income Correlation Summary
| Measurement | French Canadian | Immigrants from South America |
| Minimum | $10,964 | $19,195 |
| Maximum | $66,177 | $84,313 |
| Range | $55,213 | $65,118 |
| Mean | $37,443 | $42,614 |
| Median | $38,631 | $41,568 |
| Interquartile 25% (IQ1) | $30,758 | $35,887 |
| Interquartile 75% (IQ3) | $43,262 | $46,069 |
| Interquartile Range (IQR) | $12,504 | $10,183 |
| Standard Deviation (Sample) | $9,955 | $11,625 |
| Standard Deviation (Population) | $9,898 | $11,572 |
Similar Demographics by Per Capita Income
Demographics Similar to French Canadians by Per Capita Income
In terms of per capita income, the demographic groups most similar to French Canadians are Immigrants ($43,010, a difference of 0.020%), Spaniard ($43,028, a difference of 0.060%), Immigrants from Colombia ($42,971, a difference of 0.070%), Immigrants from Africa ($42,950, a difference of 0.12%), and German ($43,067, a difference of 0.15%).
| Demographics | Rating | Rank | Per Capita Income |
| Finns | 44.4 /100 | #179 | Average $43,461 |
| Sierra Leoneans | 42.9 /100 | #180 | Average $43,405 |
| Welsh | 38.2 /100 | #181 | Fair $43,233 |
| Immigrants | Vietnam | 38.1 /100 | #182 | Fair $43,229 |
| Germans | 33.9 /100 | #183 | Fair $43,067 |
| Spaniards | 32.9 /100 | #184 | Fair $43,028 |
| Immigrants | Immigrants | 32.5 /100 | #185 | Fair $43,010 |
| French Canadians | 32.3 /100 | #186 | Fair $43,003 |
| Immigrants | Colombia | 31.5 /100 | #187 | Fair $42,971 |
| Immigrants | Africa | 31.0 /100 | #188 | Fair $42,950 |
| Bermudans | 30.1 /100 | #189 | Fair $42,911 |
| Kenyans | 27.7 /100 | #190 | Fair $42,808 |
| Yugoslavians | 27.4 /100 | #191 | Fair $42,792 |
| Iraqis | 26.7 /100 | #192 | Fair $42,760 |
| Immigrants | Sierra Leone | 26.5 /100 | #193 | Fair $42,752 |
Demographics Similar to Immigrants from South America by Per Capita Income
In terms of per capita income, the demographic groups most similar to Immigrants from South America are Swiss ($44,076, a difference of 0.020%), Costa Rican ($44,090, a difference of 0.050%), Danish ($44,095, a difference of 0.060%), South American ($44,114, a difference of 0.10%), and Sri Lankan ($44,014, a difference of 0.12%).
| Demographics | Rating | Rank | Per Capita Income |
| Slovaks | 65.4 /100 | #156 | Good $44,229 |
| South American Indians | 64.8 /100 | #157 | Good $44,206 |
| Immigrants | Nepal | 64.3 /100 | #158 | Good $44,187 |
| South Americans | 62.4 /100 | #159 | Good $44,114 |
| Danes | 61.9 /100 | #160 | Good $44,095 |
| Costa Ricans | 61.8 /100 | #161 | Good $44,090 |
| Swiss | 61.4 /100 | #162 | Good $44,076 |
| Immigrants | South America | 61.2 /100 | #163 | Good $44,068 |
| Sri Lankans | 59.8 /100 | #164 | Average $44,014 |
| Immigrants | Philippines | 59.4 /100 | #165 | Average $44,000 |
| Immigrants | Uruguay | 59.3 /100 | #166 | Average $43,997 |
| English | 58.9 /100 | #167 | Average $43,982 |
| Belgians | 58.1 /100 | #168 | Average $43,951 |
| Immigrants | Peru | 55.3 /100 | #169 | Average $43,852 |
| Scandinavians | 55.2 /100 | #170 | Average $43,848 |