French Canadian vs Immigrants from Eastern Asia Per Capita Income
COMPARE
French Canadian
Immigrants from Eastern Asia
Per Capita Income
Per Capita Income Comparison
French Canadians
Immigrants from Eastern Asia
$43,003
PER CAPITA INCOME
32.3/ 100
METRIC RATING
186th/ 347
METRIC RANK
$53,806
PER CAPITA INCOME
100.0/ 100
METRIC RATING
23rd/ 347
METRIC RANK
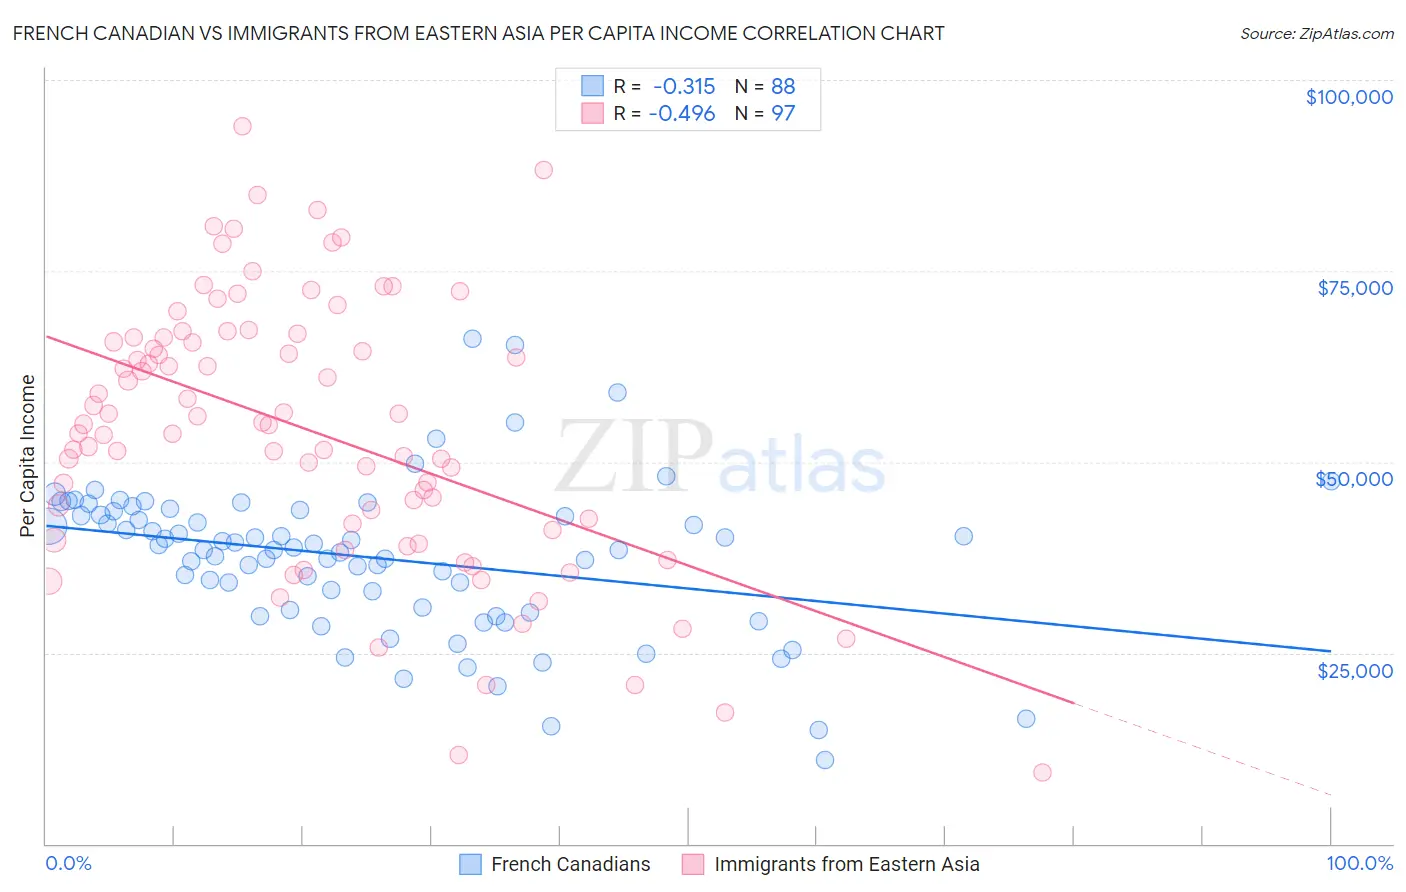
French Canadian vs Immigrants from Eastern Asia Per Capita Income Correlation Chart
The statistical analysis conducted on geographies consisting of 502,704,545 people shows a mild negative correlation between the proportion of French Canadians and per capita income in the United States with a correlation coefficient (R) of -0.315 and weighted average of $43,003. Similarly, the statistical analysis conducted on geographies consisting of 499,991,625 people shows a moderate negative correlation between the proportion of Immigrants from Eastern Asia and per capita income in the United States with a correlation coefficient (R) of -0.496 and weighted average of $53,806, a difference of 25.1%.
Per Capita Income Correlation Summary
| Measurement | French Canadian | Immigrants from Eastern Asia |
| Minimum | $10,964 | $9,290 |
| Maximum | $66,177 | $93,950 |
| Range | $55,213 | $84,660 |
| Mean | $37,443 | $54,065 |
| Median | $38,631 | $54,919 |
| Interquartile 25% (IQ1) | $30,758 | $41,457 |
| Interquartile 75% (IQ3) | $43,262 | $66,275 |
| Interquartile Range (IQR) | $12,504 | $24,818 |
| Standard Deviation (Sample) | $9,955 | $17,495 |
| Standard Deviation (Population) | $9,898 | $17,405 |
Similar Demographics by Per Capita Income
Demographics Similar to French Canadians by Per Capita Income
In terms of per capita income, the demographic groups most similar to French Canadians are Immigrants ($43,010, a difference of 0.020%), Spaniard ($43,028, a difference of 0.060%), Immigrants from Colombia ($42,971, a difference of 0.070%), Immigrants from Africa ($42,950, a difference of 0.12%), and German ($43,067, a difference of 0.15%).
| Demographics | Rating | Rank | Per Capita Income |
| Finns | 44.4 /100 | #179 | Average $43,461 |
| Sierra Leoneans | 42.9 /100 | #180 | Average $43,405 |
| Welsh | 38.2 /100 | #181 | Fair $43,233 |
| Immigrants | Vietnam | 38.1 /100 | #182 | Fair $43,229 |
| Germans | 33.9 /100 | #183 | Fair $43,067 |
| Spaniards | 32.9 /100 | #184 | Fair $43,028 |
| Immigrants | Immigrants | 32.5 /100 | #185 | Fair $43,010 |
| French Canadians | 32.3 /100 | #186 | Fair $43,003 |
| Immigrants | Colombia | 31.5 /100 | #187 | Fair $42,971 |
| Immigrants | Africa | 31.0 /100 | #188 | Fair $42,950 |
| Bermudans | 30.1 /100 | #189 | Fair $42,911 |
| Kenyans | 27.7 /100 | #190 | Fair $42,808 |
| Yugoslavians | 27.4 /100 | #191 | Fair $42,792 |
| Iraqis | 26.7 /100 | #192 | Fair $42,760 |
| Immigrants | Sierra Leone | 26.5 /100 | #193 | Fair $42,752 |
Demographics Similar to Immigrants from Eastern Asia by Per Capita Income
In terms of per capita income, the demographic groups most similar to Immigrants from Eastern Asia are Immigrants from Denmark ($53,799, a difference of 0.010%), Indian (Asian) ($53,874, a difference of 0.13%), Immigrants from Northern Europe ($54,159, a difference of 0.66%), Soviet Union ($54,202, a difference of 0.74%), and Immigrants from Japan ($53,359, a difference of 0.84%).
| Demographics | Rating | Rank | Per Capita Income |
| Immigrants | Switzerland | 100.0 /100 | #16 | Exceptional $54,866 |
| Immigrants | France | 100.0 /100 | #17 | Exceptional $54,557 |
| Thais | 100.0 /100 | #18 | Exceptional $54,307 |
| Immigrants | China | 100.0 /100 | #19 | Exceptional $54,264 |
| Soviet Union | 100.0 /100 | #20 | Exceptional $54,202 |
| Immigrants | Northern Europe | 100.0 /100 | #21 | Exceptional $54,159 |
| Indians (Asian) | 100.0 /100 | #22 | Exceptional $53,874 |
| Immigrants | Eastern Asia | 100.0 /100 | #23 | Exceptional $53,806 |
| Immigrants | Denmark | 100.0 /100 | #24 | Exceptional $53,799 |
| Immigrants | Japan | 100.0 /100 | #25 | Exceptional $53,359 |
| Russians | 100.0 /100 | #26 | Exceptional $53,154 |
| Immigrants | South Central Asia | 100.0 /100 | #27 | Exceptional $52,660 |
| Latvians | 100.0 /100 | #28 | Exceptional $52,649 |
| Israelis | 100.0 /100 | #29 | Exceptional $52,596 |
| Immigrants | Austria | 100.0 /100 | #30 | Exceptional $52,503 |