French Canadian vs Immigrants from Spain Householder Income Over 65 years
COMPARE
French Canadian
Immigrants from Spain
Householder Income Over 65 years
Householder Income Over 65 years Comparison
French Canadians
Immigrants from Spain
$57,975
HOUSEHOLDER INCOME OVER 65 YEARS
4.2/ 100
METRIC RATING
226th/ 347
METRIC RANK
$63,540
HOUSEHOLDER INCOME OVER 65 YEARS
93.7/ 100
METRIC RATING
111th/ 347
METRIC RANK
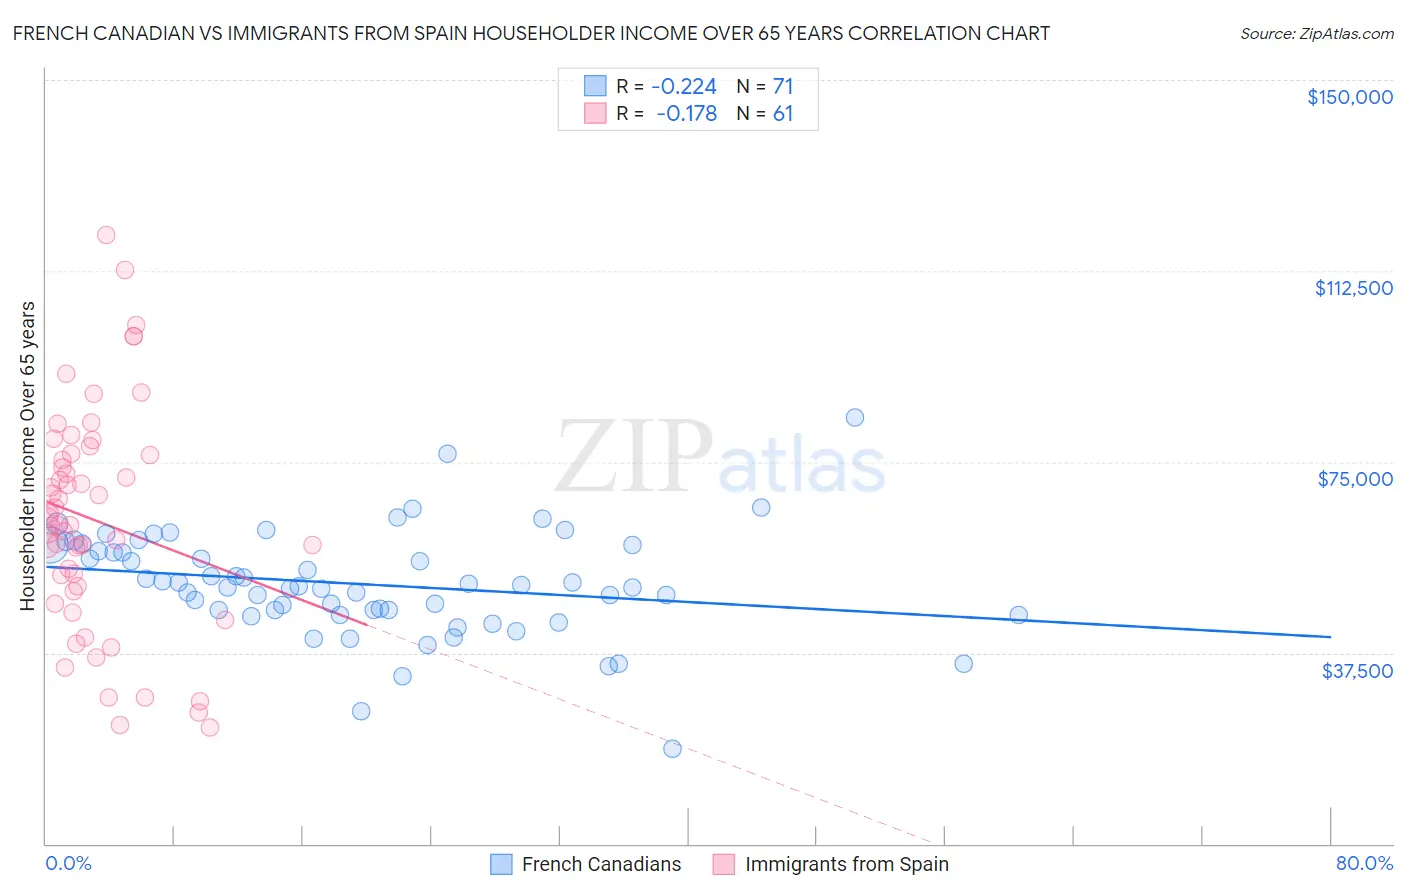
French Canadian vs Immigrants from Spain Householder Income Over 65 years Correlation Chart
The statistical analysis conducted on geographies consisting of 499,919,017 people shows a weak negative correlation between the proportion of French Canadians and household income with householder over the age of 65 in the United States with a correlation coefficient (R) of -0.224 and weighted average of $57,975. Similarly, the statistical analysis conducted on geographies consisting of 239,272,973 people shows a poor negative correlation between the proportion of Immigrants from Spain and household income with householder over the age of 65 in the United States with a correlation coefficient (R) of -0.178 and weighted average of $63,540, a difference of 9.6%.
Householder Income Over 65 years Correlation Summary
| Measurement | French Canadian | Immigrants from Spain |
| Minimum | $18,750 | $22,736 |
| Maximum | $83,631 | $119,643 |
| Range | $64,881 | $96,907 |
| Mean | $51,013 | $63,593 |
| Median | $50,515 | $62,635 |
| Interquartile 25% (IQ1) | $45,820 | $50,128 |
| Interquartile 75% (IQ3) | $58,631 | $76,487 |
| Interquartile Range (IQR) | $12,810 | $26,359 |
| Standard Deviation (Sample) | $10,428 | $21,597 |
| Standard Deviation (Population) | $10,355 | $21,419 |
Similar Demographics by Householder Income Over 65 years
Demographics Similar to French Canadians by Householder Income Over 65 years
In terms of householder income over 65 years, the demographic groups most similar to French Canadians are Venezuelan ($58,026, a difference of 0.090%), Japanese ($57,919, a difference of 0.10%), Immigrants from Albania ($57,828, a difference of 0.25%), Bermudan ($58,171, a difference of 0.34%), and Tsimshian ($58,202, a difference of 0.39%).
| Demographics | Rating | Rank | Householder Income Over 65 years |
| Malaysians | 5.5 /100 | #219 | Tragic $58,244 |
| Yugoslavians | 5.5 /100 | #220 | Tragic $58,243 |
| Immigrants | El Salvador | 5.4 /100 | #221 | Tragic $58,226 |
| Delaware | 5.3 /100 | #222 | Tragic $58,214 |
| Tsimshian | 5.2 /100 | #223 | Tragic $58,202 |
| Bermudans | 5.1 /100 | #224 | Tragic $58,171 |
| Venezuelans | 4.4 /100 | #225 | Tragic $58,026 |
| French Canadians | 4.2 /100 | #226 | Tragic $57,975 |
| Japanese | 3.9 /100 | #227 | Tragic $57,919 |
| Immigrants | Albania | 3.6 /100 | #228 | Tragic $57,828 |
| Immigrants | Colombia | 3.0 /100 | #229 | Tragic $57,658 |
| Immigrants | Cambodia | 2.8 /100 | #230 | Tragic $57,580 |
| Immigrants | Nonimmigrants | 2.4 /100 | #231 | Tragic $57,426 |
| Immigrants | Venezuela | 2.3 /100 | #232 | Tragic $57,371 |
| Immigrants | Western Africa | 1.7 /100 | #233 | Tragic $57,119 |
Demographics Similar to Immigrants from Spain by Householder Income Over 65 years
In terms of householder income over 65 years, the demographic groups most similar to Immigrants from Spain are Syrian ($63,494, a difference of 0.070%), Immigrants from Zimbabwe ($63,643, a difference of 0.16%), Immigrants from Serbia ($63,387, a difference of 0.24%), Immigrants from Saudi Arabia ($63,355, a difference of 0.29%), and European ($63,779, a difference of 0.38%).
| Demographics | Rating | Rank | Householder Income Over 65 years |
| Immigrants | Cameroon | 95.6 /100 | #104 | Exceptional $63,907 |
| Italians | 95.5 /100 | #105 | Exceptional $63,885 |
| Immigrants | Argentina | 95.5 /100 | #106 | Exceptional $63,885 |
| Pakistanis | 95.3 /100 | #107 | Exceptional $63,844 |
| Palestinians | 95.1 /100 | #108 | Exceptional $63,800 |
| Europeans | 95.0 /100 | #109 | Exceptional $63,779 |
| Immigrants | Zimbabwe | 94.3 /100 | #110 | Exceptional $63,643 |
| Immigrants | Spain | 93.7 /100 | #111 | Exceptional $63,540 |
| Syrians | 93.4 /100 | #112 | Exceptional $63,494 |
| Immigrants | Serbia | 92.7 /100 | #113 | Exceptional $63,387 |
| Immigrants | Saudi Arabia | 92.4 /100 | #114 | Exceptional $63,355 |
| Croatians | 91.4 /100 | #115 | Exceptional $63,225 |
| Guamanians/Chamorros | 91.1 /100 | #116 | Exceptional $63,187 |
| Immigrants | Croatia | 90.9 /100 | #117 | Exceptional $63,168 |
| Danes | 90.5 /100 | #118 | Exceptional $63,117 |