French Canadian vs Salvadoran Householder Income Over 65 years
COMPARE
French Canadian
Salvadoran
Householder Income Over 65 years
Householder Income Over 65 years Comparison
French Canadians
Salvadorans
$57,975
HOUSEHOLDER INCOME OVER 65 YEARS
4.2/ 100
METRIC RATING
226th/ 347
METRIC RANK
$59,141
HOUSEHOLDER INCOME OVER 65 YEARS
12.9/ 100
METRIC RATING
207th/ 347
METRIC RANK
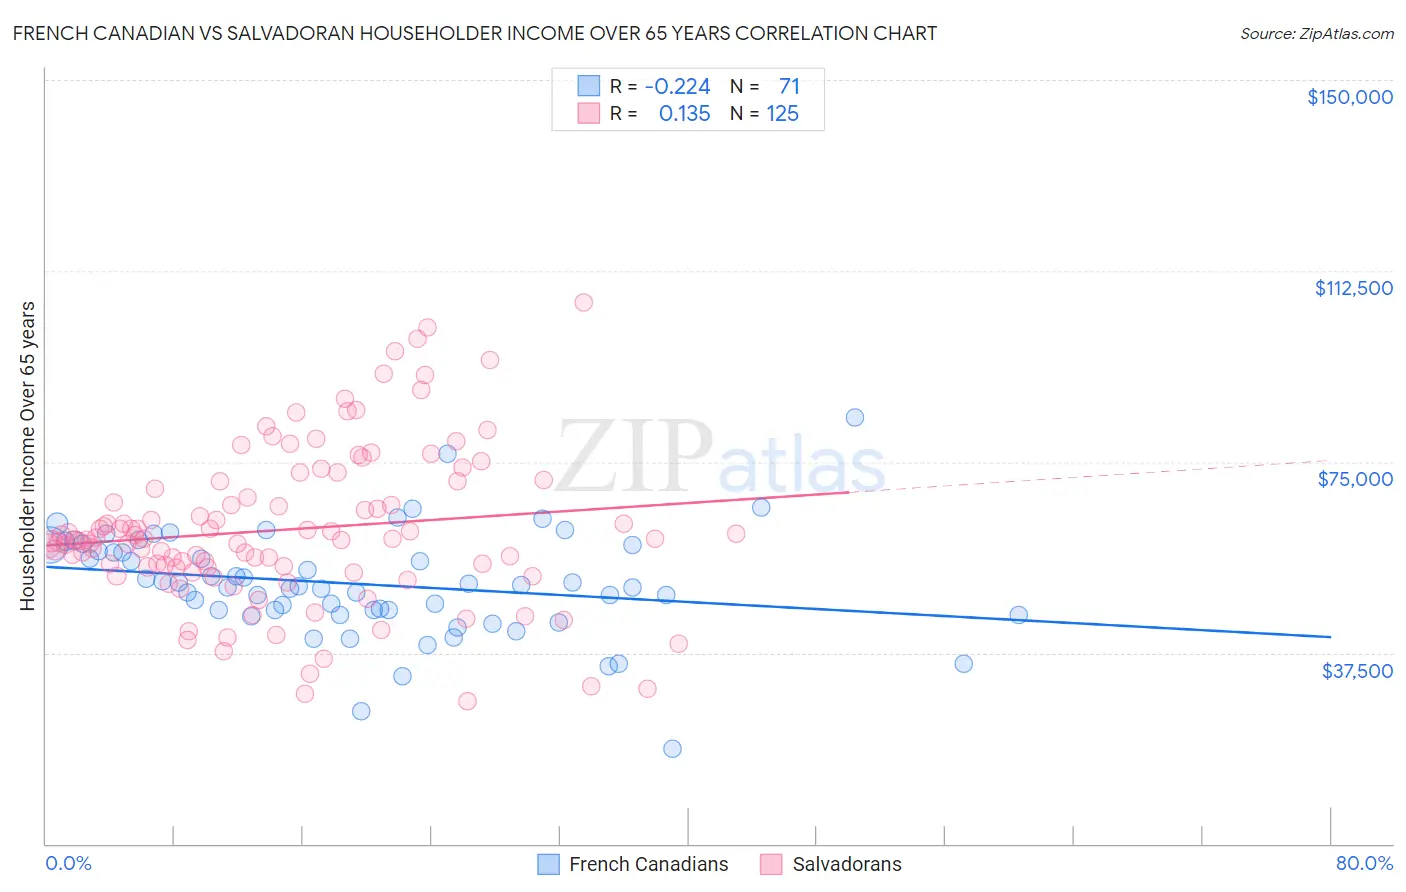
French Canadian vs Salvadoran Householder Income Over 65 years Correlation Chart
The statistical analysis conducted on geographies consisting of 499,919,017 people shows a weak negative correlation between the proportion of French Canadians and household income with householder over the age of 65 in the United States with a correlation coefficient (R) of -0.224 and weighted average of $57,975. Similarly, the statistical analysis conducted on geographies consisting of 397,216,988 people shows a poor positive correlation between the proportion of Salvadorans and household income with householder over the age of 65 in the United States with a correlation coefficient (R) of 0.135 and weighted average of $59,141, a difference of 2.0%.
Householder Income Over 65 years Correlation Summary
| Measurement | French Canadian | Salvadoran |
| Minimum | $18,750 | $28,014 |
| Maximum | $83,631 | $106,250 |
| Range | $64,881 | $78,236 |
| Mean | $51,013 | $61,666 |
| Median | $50,515 | $59,663 |
| Interquartile 25% (IQ1) | $45,820 | $54,245 |
| Interquartile 75% (IQ3) | $58,631 | $70,529 |
| Interquartile Range (IQR) | $12,810 | $16,284 |
| Standard Deviation (Sample) | $10,428 | $15,321 |
| Standard Deviation (Population) | $10,355 | $15,259 |
Demographics Similar to French Canadians and Salvadorans by Householder Income Over 65 years
In terms of householder income over 65 years, the demographic groups most similar to French Canadians are Venezuelan ($58,026, a difference of 0.090%), Bermudan ($58,171, a difference of 0.34%), Tsimshian ($58,202, a difference of 0.39%), Delaware ($58,214, a difference of 0.41%), and Immigrants from El Salvador ($58,226, a difference of 0.43%). Similarly, the demographic groups most similar to Salvadorans are Immigrants from South America ($59,151, a difference of 0.020%), Uruguayan ($59,090, a difference of 0.090%), Slovak ($59,039, a difference of 0.17%), Nigerian ($58,992, a difference of 0.25%), and Immigrants from Nigeria ($58,942, a difference of 0.34%).
| Demographics | Rating | Rank | Householder Income Over 65 years |
| Immigrants | South America | 13.0 /100 | #206 | Poor $59,151 |
| Salvadorans | 12.9 /100 | #207 | Poor $59,141 |
| Uruguayans | 12.3 /100 | #208 | Poor $59,090 |
| Slovaks | 11.7 /100 | #209 | Poor $59,039 |
| Nigerians | 11.2 /100 | #210 | Poor $58,992 |
| Immigrants | Nigeria | 10.7 /100 | #211 | Poor $58,942 |
| Colombians | 9.8 /100 | #212 | Tragic $58,851 |
| Whites/Caucasians | 9.8 /100 | #213 | Tragic $58,847 |
| Nepalese | 9.0 /100 | #214 | Tragic $58,761 |
| Immigrants | Ghana | 7.9 /100 | #215 | Tragic $58,624 |
| Immigrants | Middle Africa | 6.2 /100 | #216 | Tragic $58,375 |
| Sudanese | 5.7 /100 | #217 | Tragic $58,281 |
| Panamanians | 5.6 /100 | #218 | Tragic $58,266 |
| Malaysians | 5.5 /100 | #219 | Tragic $58,244 |
| Yugoslavians | 5.5 /100 | #220 | Tragic $58,243 |
| Immigrants | El Salvador | 5.4 /100 | #221 | Tragic $58,226 |
| Delaware | 5.3 /100 | #222 | Tragic $58,214 |
| Tsimshian | 5.2 /100 | #223 | Tragic $58,202 |
| Bermudans | 5.1 /100 | #224 | Tragic $58,171 |
| Venezuelans | 4.4 /100 | #225 | Tragic $58,026 |
| French Canadians | 4.2 /100 | #226 | Tragic $57,975 |