Immigrants from Belgium vs Laotian Householder Income Under 25 years
COMPARE
Immigrants from Belgium
Laotian
Householder Income Under 25 years
Householder Income Under 25 years Comparison
Immigrants from Belgium
Laotians
$54,830
HOUSEHOLDER INCOME UNDER 25 YEARS
99.8/ 100
METRIC RATING
63rd/ 347
METRIC RANK
$54,369
HOUSEHOLDER INCOME UNDER 25 YEARS
99.5/ 100
METRIC RATING
83rd/ 347
METRIC RANK
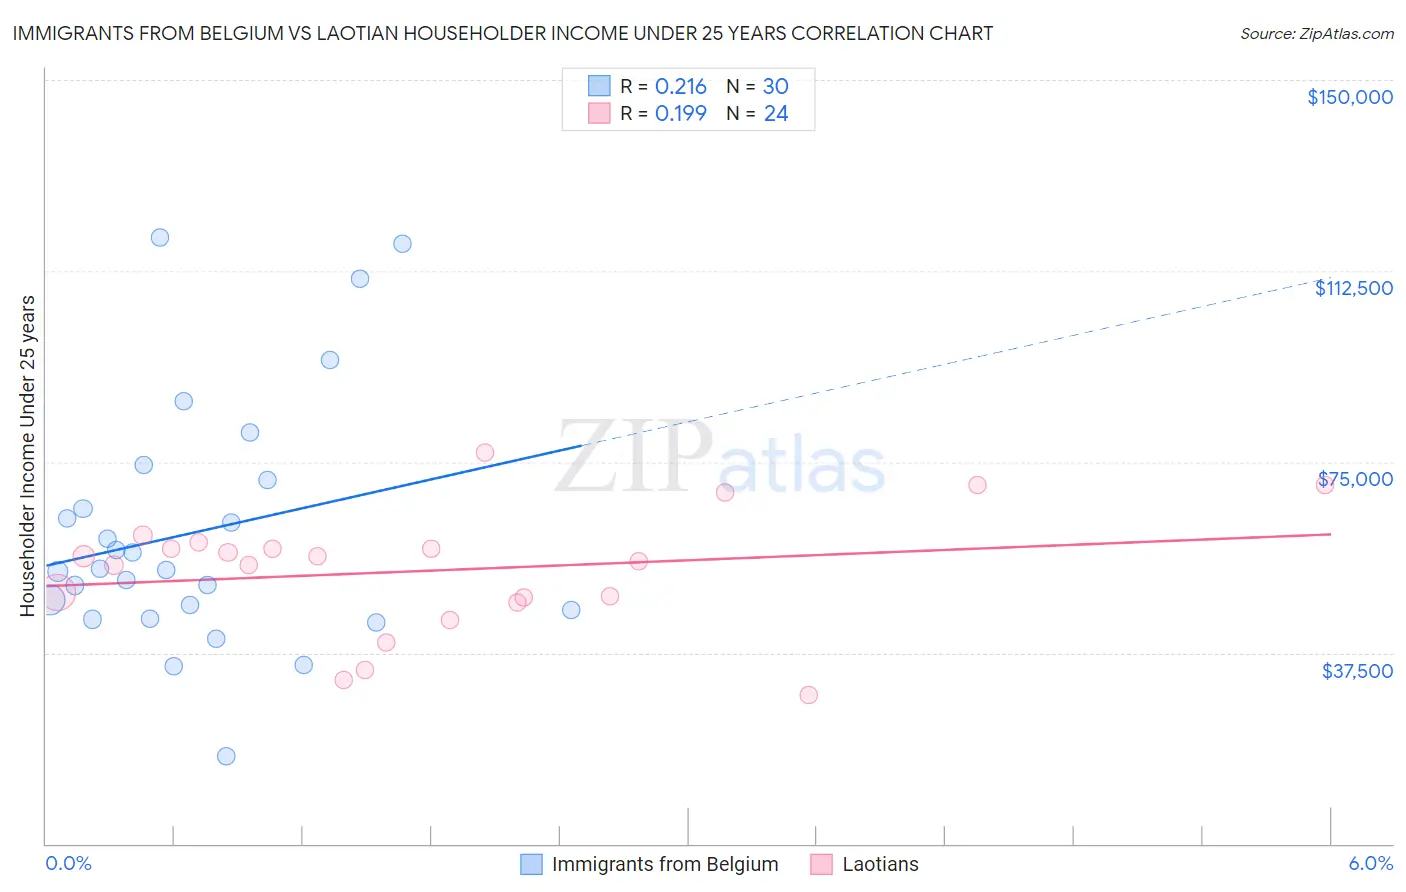
Immigrants from Belgium vs Laotian Householder Income Under 25 years Correlation Chart
The statistical analysis conducted on geographies consisting of 131,972,517 people shows a weak positive correlation between the proportion of Immigrants from Belgium and household income with householder under the age of 25 in the United States with a correlation coefficient (R) of 0.216 and weighted average of $54,830. Similarly, the statistical analysis conducted on geographies consisting of 201,813,487 people shows a poor positive correlation between the proportion of Laotians and household income with householder under the age of 25 in the United States with a correlation coefficient (R) of 0.199 and weighted average of $54,369, a difference of 0.85%.
Householder Income Under 25 years Correlation Summary
| Measurement | Immigrants from Belgium | Laotian |
| Minimum | $17,103 | $29,129 |
| Maximum | $119,035 | $76,932 |
| Range | $101,933 | $47,803 |
| Mean | $61,275 | $53,668 |
| Median | $53,928 | $55,928 |
| Interquartile 25% (IQ1) | $46,000 | $47,909 |
| Interquartile 75% (IQ3) | $71,485 | $58,617 |
| Interquartile Range (IQR) | $25,485 | $10,708 |
| Standard Deviation (Sample) | $24,412 | $12,091 |
| Standard Deviation (Population) | $24,002 | $11,836 |
Demographics Similar to Immigrants from Belgium and Laotians by Householder Income Under 25 years
In terms of householder income under 25 years, the demographic groups most similar to Immigrants from Belgium are Burmese ($54,800, a difference of 0.060%), Yup'ik ($54,732, a difference of 0.18%), Immigrants from Bangladesh ($54,714, a difference of 0.21%), Okinawan ($54,701, a difference of 0.24%), and Tsimshian ($54,649, a difference of 0.33%). Similarly, the demographic groups most similar to Laotians are Russian ($54,389, a difference of 0.040%), Portuguese ($54,436, a difference of 0.12%), Egyptian ($54,444, a difference of 0.14%), Immigrants from Italy ($54,449, a difference of 0.15%), and Nepalese ($54,472, a difference of 0.19%).
| Demographics | Rating | Rank | Householder Income Under 25 years |
| Immigrants | Belgium | 99.8 /100 | #63 | Exceptional $54,830 |
| Burmese | 99.8 /100 | #64 | Exceptional $54,800 |
| Yup'ik | 99.8 /100 | #65 | Exceptional $54,732 |
| Immigrants | Bangladesh | 99.8 /100 | #66 | Exceptional $54,714 |
| Okinawans | 99.8 /100 | #67 | Exceptional $54,701 |
| Tsimshian | 99.8 /100 | #68 | Exceptional $54,649 |
| Samoans | 99.7 /100 | #69 | Exceptional $54,610 |
| Immigrants | El Salvador | 99.7 /100 | #70 | Exceptional $54,599 |
| Immigrants | Morocco | 99.7 /100 | #71 | Exceptional $54,593 |
| Immigrants | Northern Europe | 99.7 /100 | #72 | Exceptional $54,571 |
| Macedonians | 99.7 /100 | #73 | Exceptional $54,563 |
| Immigrants | Grenada | 99.7 /100 | #74 | Exceptional $54,538 |
| Immigrants | Sri Lanka | 99.7 /100 | #75 | Exceptional $54,512 |
| Immigrants | Brazil | 99.6 /100 | #76 | Exceptional $54,487 |
| Immigrants | Southern Europe | 99.6 /100 | #77 | Exceptional $54,484 |
| Nepalese | 99.6 /100 | #78 | Exceptional $54,472 |
| Immigrants | Italy | 99.6 /100 | #79 | Exceptional $54,449 |
| Egyptians | 99.6 /100 | #80 | Exceptional $54,444 |
| Portuguese | 99.6 /100 | #81 | Exceptional $54,436 |
| Russians | 99.5 /100 | #82 | Exceptional $54,389 |
| Laotians | 99.5 /100 | #83 | Exceptional $54,369 |