Immigrants from Romania vs Immigrants from Netherlands Householder Income Under 25 years
COMPARE
Immigrants from Romania
Immigrants from Netherlands
Householder Income Under 25 years
Householder Income Under 25 years Comparison
Immigrants from Romania
Immigrants from Netherlands
$55,522
HOUSEHOLDER INCOME UNDER 25 YEARS
100.0/ 100
METRIC RATING
51st/ 347
METRIC RANK
$52,592
HOUSEHOLDER INCOME UNDER 25 YEARS
72.8/ 100
METRIC RATING
158th/ 347
METRIC RANK
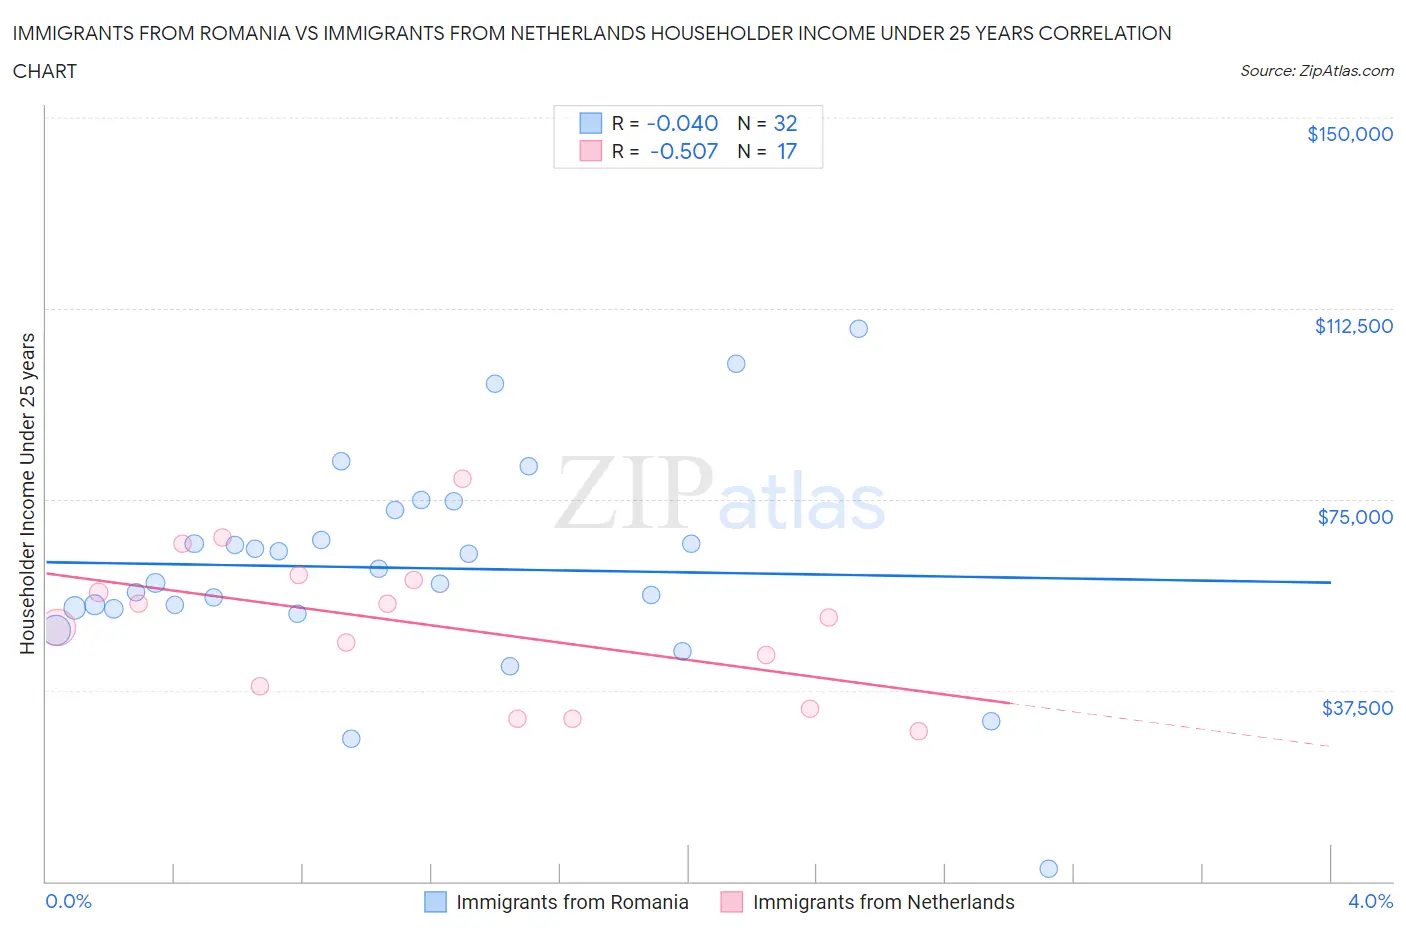
Immigrants from Romania vs Immigrants from Netherlands Householder Income Under 25 years Correlation Chart
The statistical analysis conducted on geographies consisting of 223,431,130 people shows no correlation between the proportion of Immigrants from Romania and household income with householder under the age of 25 in the United States with a correlation coefficient (R) of -0.040 and weighted average of $55,522. Similarly, the statistical analysis conducted on geographies consisting of 207,489,365 people shows a substantial negative correlation between the proportion of Immigrants from Netherlands and household income with householder under the age of 25 in the United States with a correlation coefficient (R) of -0.507 and weighted average of $52,592, a difference of 5.6%.
Householder Income Under 25 years Correlation Summary
| Measurement | Immigrants from Romania | Immigrants from Netherlands |
| Minimum | $2,499 | $29,438 |
| Maximum | $108,452 | $79,004 |
| Range | $105,953 | $49,567 |
| Mean | $61,531 | $50,356 |
| Median | $59,956 | $51,917 |
| Interquartile 25% (IQ1) | $53,639 | $36,019 |
| Interquartile 75% (IQ3) | $70,028 | $59,656 |
| Interquartile Range (IQR) | $16,389 | $23,637 |
| Standard Deviation (Sample) | $20,715 | $14,151 |
| Standard Deviation (Population) | $20,389 | $13,728 |
Similar Demographics by Householder Income Under 25 years
Demographics Similar to Immigrants from Romania by Householder Income Under 25 years
In terms of householder income under 25 years, the demographic groups most similar to Immigrants from Romania are Immigrants from Indonesia ($55,521, a difference of 0.0%), Puget Sound Salish ($55,543, a difference of 0.040%), Iranian ($55,548, a difference of 0.050%), Immigrants from Vietnam ($55,562, a difference of 0.070%), and Spanish American Indian ($55,573, a difference of 0.090%).
| Demographics | Rating | Rank | Householder Income Under 25 years |
| Paraguayans | 100.0 /100 | #44 | Exceptional $55,614 |
| Spanish American Indians | 100.0 /100 | #45 | Exceptional $55,573 |
| Immigrants | Eastern Europe | 100.0 /100 | #46 | Exceptional $55,572 |
| Cambodians | 100.0 /100 | #47 | Exceptional $55,571 |
| Immigrants | Vietnam | 100.0 /100 | #48 | Exceptional $55,562 |
| Iranians | 100.0 /100 | #49 | Exceptional $55,548 |
| Puget Sound Salish | 100.0 /100 | #50 | Exceptional $55,543 |
| Immigrants | Romania | 100.0 /100 | #51 | Exceptional $55,522 |
| Immigrants | Indonesia | 100.0 /100 | #52 | Exceptional $55,521 |
| Immigrants | Poland | 100.0 /100 | #53 | Exceptional $55,474 |
| Sri Lankans | 100.0 /100 | #54 | Exceptional $55,470 |
| Immigrants | Ukraine | 100.0 /100 | #55 | Exceptional $55,447 |
| Salvadorans | 100.0 /100 | #56 | Exceptional $55,412 |
| Soviet Union | 100.0 /100 | #57 | Exceptional $55,340 |
| Guyanese | 99.9 /100 | #58 | Exceptional $55,210 |
Demographics Similar to Immigrants from Netherlands by Householder Income Under 25 years
In terms of householder income under 25 years, the demographic groups most similar to Immigrants from Netherlands are Ghanaian ($52,594, a difference of 0.0%), Immigrants from Denmark ($52,612, a difference of 0.040%), Immigrants from Nepal ($52,611, a difference of 0.040%), Immigrants from the Azores ($52,621, a difference of 0.060%), and Central American ($52,626, a difference of 0.070%).
| Demographics | Rating | Rank | Householder Income Under 25 years |
| Immigrants | Scotland | 75.0 /100 | #151 | Good $52,638 |
| Trinidadians and Tobagonians | 74.6 /100 | #152 | Good $52,631 |
| Central Americans | 74.4 /100 | #153 | Good $52,626 |
| Immigrants | Azores | 74.2 /100 | #154 | Good $52,621 |
| Immigrants | Denmark | 73.8 /100 | #155 | Good $52,612 |
| Immigrants | Nepal | 73.7 /100 | #156 | Good $52,611 |
| Ghanaians | 72.9 /100 | #157 | Good $52,594 |
| Immigrants | Netherlands | 72.8 /100 | #158 | Good $52,592 |
| Mongolians | 70.2 /100 | #159 | Good $52,540 |
| Immigrants | Turkey | 68.3 /100 | #160 | Good $52,503 |
| Uruguayans | 66.2 /100 | #161 | Good $52,465 |
| Immigrants | Cambodia | 65.4 /100 | #162 | Good $52,450 |
| Immigrants | Chile | 64.8 /100 | #163 | Good $52,440 |
| Immigrants | Trinidad and Tobago | 64.7 /100 | #164 | Good $52,437 |
| Poles | 63.0 /100 | #165 | Good $52,407 |