Finnish vs Immigrants from Africa Bachelor's Degree
COMPARE
Finnish
Immigrants from Africa
Bachelor's Degree
Bachelor's Degree Comparison
Finns
Immigrants from Africa
36.7%
BACHELOR'S DEGREE
22.2/ 100
METRIC RATING
205th/ 347
METRIC RANK
38.9%
BACHELOR'S DEGREE
76.5/ 100
METRIC RATING
151st/ 347
METRIC RANK
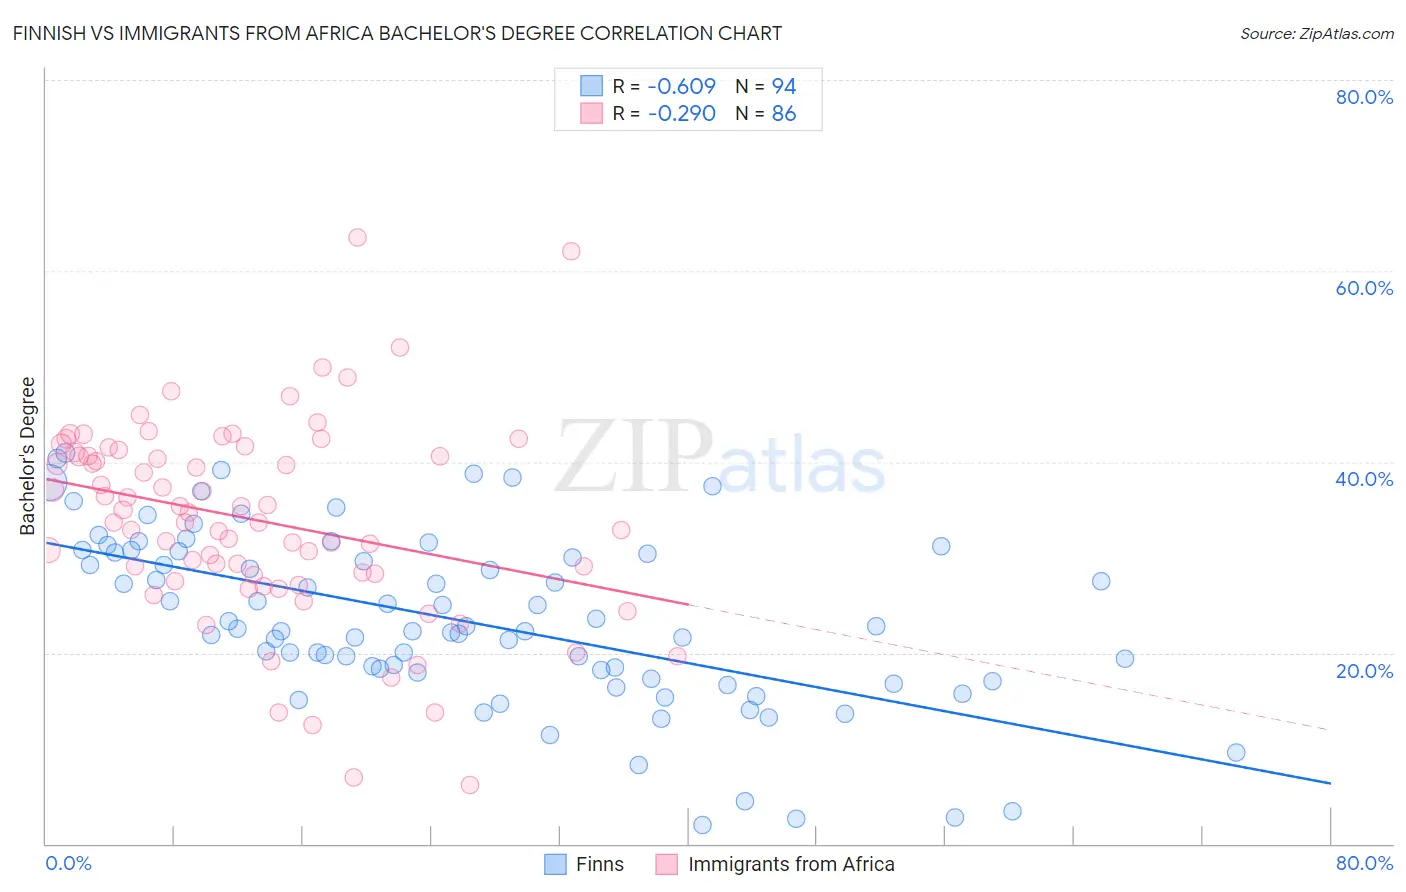
Finnish vs Immigrants from Africa Bachelor's Degree Correlation Chart
The statistical analysis conducted on geographies consisting of 404,648,142 people shows a significant negative correlation between the proportion of Finns and percentage of population with at least bachelor's degree education in the United States with a correlation coefficient (R) of -0.609 and weighted average of 36.7%. Similarly, the statistical analysis conducted on geographies consisting of 469,379,940 people shows a weak negative correlation between the proportion of Immigrants from Africa and percentage of population with at least bachelor's degree education in the United States with a correlation coefficient (R) of -0.290 and weighted average of 38.9%, a difference of 6.1%.
Bachelor's Degree Correlation Summary
| Measurement | Finnish | Immigrants from Africa |
| Minimum | 2.0% | 6.2% |
| Maximum | 40.9% | 63.5% |
| Range | 38.9% | 57.3% |
| Mean | 23.4% | 33.9% |
| Median | 22.4% | 34.2% |
| Interquartile 25% (IQ1) | 18.0% | 28.2% |
| Interquartile 75% (IQ3) | 30.5% | 41.0% |
| Interquartile Range (IQR) | 12.6% | 12.9% |
| Standard Deviation (Sample) | 9.0% | 10.5% |
| Standard Deviation (Population) | 9.0% | 10.4% |
Similar Demographics by Bachelor's Degree
Demographics Similar to Finns by Bachelor's Degree
In terms of bachelor's degree, the demographic groups most similar to Finns are Immigrants (36.7%, a difference of 0.10%), Immigrants from Nigeria (36.7%, a difference of 0.14%), Spaniard (36.6%, a difference of 0.14%), Immigrants from Middle Africa (36.6%, a difference of 0.23%), and Immigrants from Zaire (36.8%, a difference of 0.43%).
| Demographics | Rating | Rank | Bachelor's Degree |
| Welsh | 29.1 /100 | #198 | Fair 37.0% |
| Immigrants | Costa Rica | 27.4 /100 | #199 | Fair 36.9% |
| Immigrants | Ghana | 27.4 /100 | #200 | Fair 36.9% |
| Immigrants | South Eastern Asia | 25.4 /100 | #201 | Fair 36.8% |
| Immigrants | Zaire | 25.3 /100 | #202 | Fair 36.8% |
| Immigrants | Nigeria | 23.1 /100 | #203 | Fair 36.7% |
| Immigrants | Immigrants | 22.8 /100 | #204 | Fair 36.7% |
| Finns | 22.2 /100 | #205 | Fair 36.7% |
| Spaniards | 21.2 /100 | #206 | Fair 36.6% |
| Immigrants | Middle Africa | 20.6 /100 | #207 | Fair 36.6% |
| Immigrants | Thailand | 19.4 /100 | #208 | Poor 36.5% |
| Panamanians | 18.8 /100 | #209 | Poor 36.5% |
| French | 18.6 /100 | #210 | Poor 36.5% |
| Scotch-Irish | 18.3 /100 | #211 | Poor 36.4% |
| Immigrants | Philippines | 17.8 /100 | #212 | Poor 36.4% |
Demographics Similar to Immigrants from Africa by Bachelor's Degree
In terms of bachelor's degree, the demographic groups most similar to Immigrants from Africa are Sudanese (38.9%, a difference of 0.020%), Slavic (38.9%, a difference of 0.080%), South American (38.9%, a difference of 0.10%), Immigrants from Poland (39.0%, a difference of 0.13%), and Canadian (38.8%, a difference of 0.20%).
| Demographics | Rating | Rank | Bachelor's Degree |
| Immigrants | Afghanistan | 79.7 /100 | #144 | Good 39.1% |
| Slovenes | 79.5 /100 | #145 | Good 39.1% |
| Swedes | 79.2 /100 | #146 | Good 39.1% |
| Immigrants | Sierra Leone | 79.0 /100 | #147 | Good 39.0% |
| Iraqis | 78.1 /100 | #148 | Good 39.0% |
| Immigrants | Poland | 77.5 /100 | #149 | Good 39.0% |
| South Americans | 77.3 /100 | #150 | Good 38.9% |
| Immigrants | Africa | 76.5 /100 | #151 | Good 38.9% |
| Sudanese | 76.4 /100 | #152 | Good 38.9% |
| Slavs | 75.9 /100 | #153 | Good 38.9% |
| Canadians | 75.0 /100 | #154 | Good 38.8% |
| Immigrants | Kenya | 73.8 /100 | #155 | Good 38.8% |
| Kenyans | 72.5 /100 | #156 | Good 38.7% |
| Immigrants | South America | 70.1 /100 | #157 | Good 38.6% |
| Immigrants | Germany | 69.6 /100 | #158 | Good 38.6% |