Fijian vs Immigrants from South America 1st Grade
COMPARE
Fijian
Immigrants from South America
1st Grade
1st Grade Comparison
Fijians
Immigrants from South America
97.5%
1ST GRADE
0.5/ 100
METRIC RATING
259th/ 347
METRIC RANK
97.5%
1ST GRADE
0.4/ 100
METRIC RATING
263rd/ 347
METRIC RANK
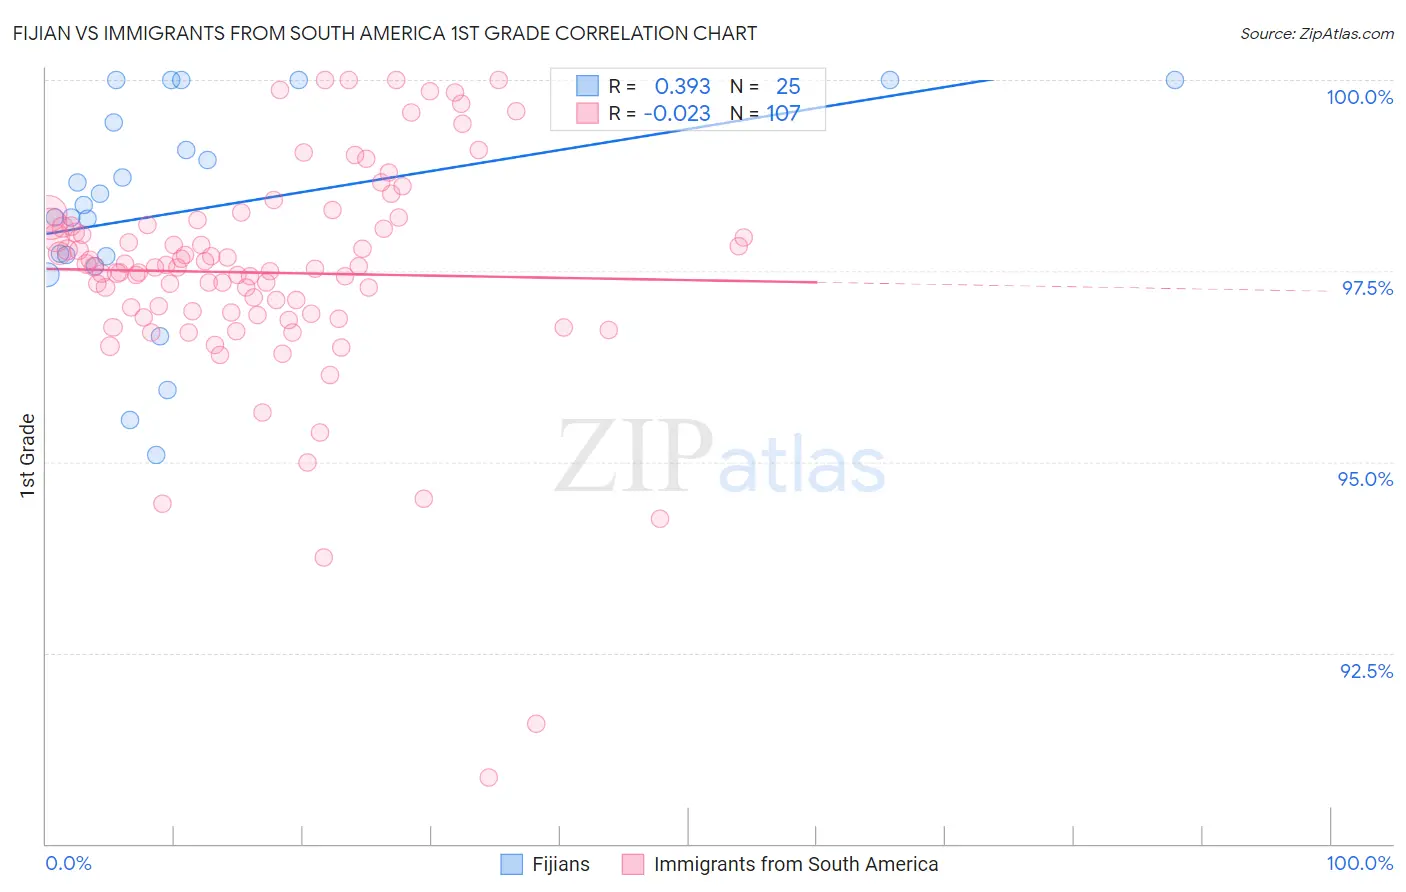
Fijian vs Immigrants from South America 1st Grade Correlation Chart
The statistical analysis conducted on geographies consisting of 55,948,842 people shows a mild positive correlation between the proportion of Fijians and percentage of population with at least 1st grade education in the United States with a correlation coefficient (R) of 0.393 and weighted average of 97.5%. Similarly, the statistical analysis conducted on geographies consisting of 486,429,719 people shows no correlation between the proportion of Immigrants from South America and percentage of population with at least 1st grade education in the United States with a correlation coefficient (R) of -0.023 and weighted average of 97.5%, a difference of 0.010%.
1st Grade Correlation Summary
| Measurement | Fijian | Immigrants from South America |
| Minimum | 95.1% | 90.9% |
| Maximum | 100.0% | 100.0% |
| Range | 4.9% | 9.1% |
| Mean | 98.3% | 97.5% |
| Median | 98.4% | 97.6% |
| Interquartile 25% (IQ1) | 97.6% | 96.9% |
| Interquartile 75% (IQ3) | 99.7% | 98.1% |
| Interquartile Range (IQR) | 2.1% | 1.2% |
| Standard Deviation (Sample) | 1.4% | 1.5% |
| Standard Deviation (Population) | 1.4% | 1.5% |
Demographics Similar to Fijians and Immigrants from South America by 1st Grade
In terms of 1st grade, the demographic groups most similar to Fijians are Armenian (97.5%, a difference of 0.0%), Yaqui (97.5%, a difference of 0.010%), Indian (Asian) (97.5%, a difference of 0.010%), Immigrants from Ethiopia (97.5%, a difference of 0.010%), and Assyrian/Chaldean/Syriac (97.5%, a difference of 0.010%). Similarly, the demographic groups most similar to Immigrants from South America are Immigrants from Ethiopia (97.5%, a difference of 0.0%), Assyrian/Chaldean/Syriac (97.5%, a difference of 0.0%), Taiwanese (97.5%, a difference of 0.0%), Armenian (97.5%, a difference of 0.010%), and Cuban (97.5%, a difference of 0.010%).
| Demographics | Rating | Rank | 1st Grade |
| Immigrants | Iraq | 0.9 /100 | #251 | Tragic 97.6% |
| Immigrants | Africa | 0.9 /100 | #252 | Tragic 97.6% |
| Immigrants | Congo | 0.7 /100 | #253 | Tragic 97.5% |
| Immigrants | Asia | 0.7 /100 | #254 | Tragic 97.5% |
| Immigrants | Colombia | 0.6 /100 | #255 | Tragic 97.5% |
| Jamaicans | 0.6 /100 | #256 | Tragic 97.5% |
| Yaqui | 0.6 /100 | #257 | Tragic 97.5% |
| Indians (Asian) | 0.6 /100 | #258 | Tragic 97.5% |
| Fijians | 0.5 /100 | #259 | Tragic 97.5% |
| Armenians | 0.5 /100 | #260 | Tragic 97.5% |
| Immigrants | Ethiopia | 0.4 /100 | #261 | Tragic 97.5% |
| Assyrians/Chaldeans/Syriacs | 0.4 /100 | #262 | Tragic 97.5% |
| Immigrants | South America | 0.4 /100 | #263 | Tragic 97.5% |
| Taiwanese | 0.4 /100 | #264 | Tragic 97.5% |
| Cubans | 0.3 /100 | #265 | Tragic 97.5% |
| Immigrants | Liberia | 0.3 /100 | #266 | Tragic 97.5% |
| Immigrants | Sierra Leone | 0.3 /100 | #267 | Tragic 97.5% |
| Immigrants | Nigeria | 0.3 /100 | #268 | Tragic 97.5% |
| West Indians | 0.3 /100 | #269 | Tragic 97.5% |
| Immigrants | Jamaica | 0.2 /100 | #270 | Tragic 97.5% |
| Immigrants | Cameroon | 0.2 /100 | #271 | Tragic 97.4% |