Fijian vs Immigrants from Dominica Per Capita Income
COMPARE
Fijian
Immigrants from Dominica
Per Capita Income
Per Capita Income Comparison
Fijians
Immigrants from Dominica
$36,690
PER CAPITA INCOME
0.0/ 100
METRIC RATING
308th/ 347
METRIC RANK
$37,952
PER CAPITA INCOME
0.2/ 100
METRIC RATING
281st/ 347
METRIC RANK
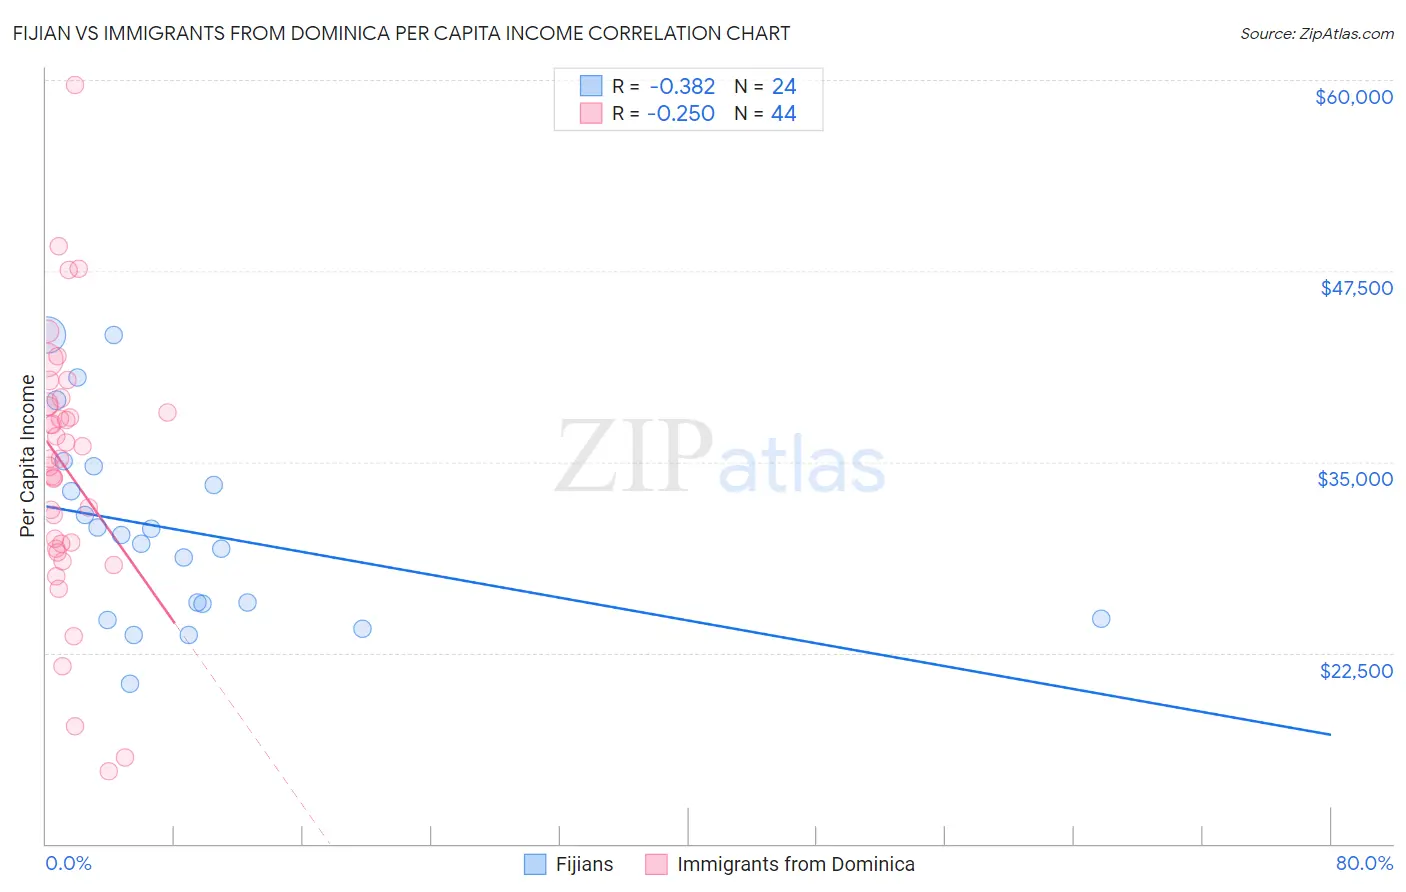
Fijian vs Immigrants from Dominica Per Capita Income Correlation Chart
The statistical analysis conducted on geographies consisting of 55,948,768 people shows a mild negative correlation between the proportion of Fijians and per capita income in the United States with a correlation coefficient (R) of -0.382 and weighted average of $36,690. Similarly, the statistical analysis conducted on geographies consisting of 83,794,667 people shows a weak negative correlation between the proportion of Immigrants from Dominica and per capita income in the United States with a correlation coefficient (R) of -0.250 and weighted average of $37,952, a difference of 3.4%.
Per Capita Income Correlation Summary
| Measurement | Fijian | Immigrants from Dominica |
| Minimum | $20,445 | $14,729 |
| Maximum | $43,340 | $59,651 |
| Range | $22,895 | $44,922 |
| Mean | $30,488 | $34,508 |
| Median | $29,934 | $35,220 |
| Interquartile 25% (IQ1) | $25,226 | $29,494 |
| Interquartile 75% (IQ3) | $34,063 | $38,721 |
| Interquartile Range (IQR) | $8,837 | $9,227 |
| Standard Deviation (Sample) | $6,360 | $8,665 |
| Standard Deviation (Population) | $6,227 | $8,566 |
Similar Demographics by Per Capita Income
Demographics Similar to Fijians by Per Capita Income
In terms of per capita income, the demographic groups most similar to Fijians are Immigrants from Honduras ($36,665, a difference of 0.070%), Ute ($36,651, a difference of 0.10%), Chippewa ($36,631, a difference of 0.16%), Immigrants from Latin America ($36,823, a difference of 0.36%), and Immigrants from Haiti ($36,849, a difference of 0.43%).
| Demographics | Rating | Rank | Per Capita Income |
| Ottawa | 0.1 /100 | #301 | Tragic $37,101 |
| Shoshone | 0.1 /100 | #302 | Tragic $37,072 |
| Paiute | 0.1 /100 | #303 | Tragic $37,066 |
| Hondurans | 0.1 /100 | #304 | Tragic $37,031 |
| Inupiat | 0.1 /100 | #305 | Tragic $36,999 |
| Immigrants | Haiti | 0.0 /100 | #306 | Tragic $36,849 |
| Immigrants | Latin America | 0.0 /100 | #307 | Tragic $36,823 |
| Fijians | 0.0 /100 | #308 | Tragic $36,690 |
| Immigrants | Honduras | 0.0 /100 | #309 | Tragic $36,665 |
| Ute | 0.0 /100 | #310 | Tragic $36,651 |
| Chippewa | 0.0 /100 | #311 | Tragic $36,631 |
| Chickasaw | 0.0 /100 | #312 | Tragic $36,475 |
| Bahamians | 0.0 /100 | #313 | Tragic $36,427 |
| Seminole | 0.0 /100 | #314 | Tragic $36,180 |
| Yaqui | 0.0 /100 | #315 | Tragic $36,112 |
Demographics Similar to Immigrants from Dominica by Per Capita Income
In terms of per capita income, the demographic groups most similar to Immigrants from Dominica are Colville ($38,047, a difference of 0.25%), Potawatomi ($38,046, a difference of 0.25%), Immigrants from Laos ($37,857, a difference of 0.25%), Pennsylvania German ($37,842, a difference of 0.29%), and Immigrants from Nicaragua ($38,065, a difference of 0.30%).
| Demographics | Rating | Rank | Per Capita Income |
| Immigrants | El Salvador | 0.3 /100 | #274 | Tragic $38,394 |
| Immigrants | Liberia | 0.2 /100 | #275 | Tragic $38,165 |
| Hmong | 0.2 /100 | #276 | Tragic $38,120 |
| Comanche | 0.2 /100 | #277 | Tragic $38,088 |
| Immigrants | Nicaragua | 0.2 /100 | #278 | Tragic $38,065 |
| Colville | 0.2 /100 | #279 | Tragic $38,047 |
| Potawatomi | 0.2 /100 | #280 | Tragic $38,046 |
| Immigrants | Dominica | 0.2 /100 | #281 | Tragic $37,952 |
| Immigrants | Laos | 0.1 /100 | #282 | Tragic $37,857 |
| Pennsylvania Germans | 0.1 /100 | #283 | Tragic $37,842 |
| Africans | 0.1 /100 | #284 | Tragic $37,785 |
| Guatemalans | 0.1 /100 | #285 | Tragic $37,766 |
| Central American Indians | 0.1 /100 | #286 | Tragic $37,699 |
| Dominicans | 0.1 /100 | #287 | Tragic $37,697 |
| Blackfeet | 0.1 /100 | #288 | Tragic $37,695 |