Fijian vs Menominee Per Capita Income
COMPARE
Fijian
Menominee
Per Capita Income
Per Capita Income Comparison
Fijians
Menominee
$36,690
PER CAPITA INCOME
0.0/ 100
METRIC RATING
308th/ 347
METRIC RANK
$34,578
PER CAPITA INCOME
0.0/ 100
METRIC RATING
328th/ 347
METRIC RANK
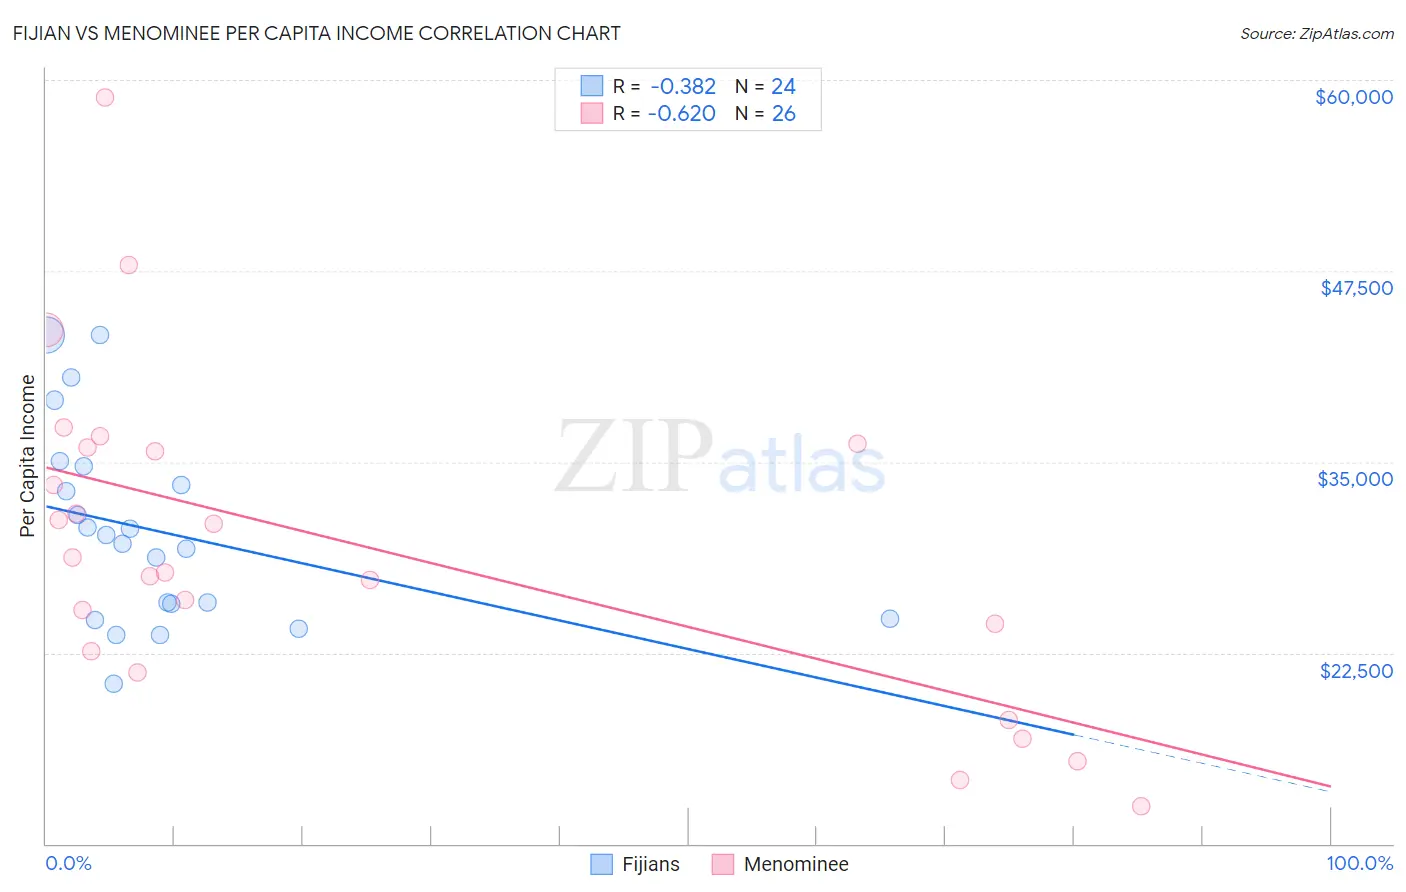
Fijian vs Menominee Per Capita Income Correlation Chart
The statistical analysis conducted on geographies consisting of 55,948,768 people shows a mild negative correlation between the proportion of Fijians and per capita income in the United States with a correlation coefficient (R) of -0.382 and weighted average of $36,690. Similarly, the statistical analysis conducted on geographies consisting of 45,778,979 people shows a significant negative correlation between the proportion of Menominee and per capita income in the United States with a correlation coefficient (R) of -0.620 and weighted average of $34,578, a difference of 6.1%.
Per Capita Income Correlation Summary
| Measurement | Fijian | Menominee |
| Minimum | $20,445 | $12,454 |
| Maximum | $43,340 | $58,872 |
| Range | $22,895 | $46,418 |
| Mean | $30,488 | $29,500 |
| Median | $29,934 | $28,225 |
| Interquartile 25% (IQ1) | $25,226 | $22,568 |
| Interquartile 75% (IQ3) | $34,063 | $35,908 |
| Interquartile Range (IQR) | $8,837 | $13,340 |
| Standard Deviation (Sample) | $6,360 | $10,696 |
| Standard Deviation (Population) | $6,227 | $10,488 |
Demographics Similar to Fijians and Menominee by Per Capita Income
In terms of per capita income, the demographic groups most similar to Fijians are Immigrants from Honduras ($36,665, a difference of 0.070%), Ute ($36,651, a difference of 0.10%), Chippewa ($36,631, a difference of 0.16%), Chickasaw ($36,475, a difference of 0.59%), and Bahamian ($36,427, a difference of 0.72%). Similarly, the demographic groups most similar to Menominee are Apache ($34,886, a difference of 0.89%), Immigrants from Cuba ($34,910, a difference of 0.96%), Immigrants from Central America ($34,974, a difference of 1.1%), Kiowa ($35,102, a difference of 1.5%), and Cheyenne ($35,276, a difference of 2.0%).
| Demographics | Rating | Rank | Per Capita Income |
| Fijians | 0.0 /100 | #308 | Tragic $36,690 |
| Immigrants | Honduras | 0.0 /100 | #309 | Tragic $36,665 |
| Ute | 0.0 /100 | #310 | Tragic $36,651 |
| Chippewa | 0.0 /100 | #311 | Tragic $36,631 |
| Chickasaw | 0.0 /100 | #312 | Tragic $36,475 |
| Bahamians | 0.0 /100 | #313 | Tragic $36,427 |
| Seminole | 0.0 /100 | #314 | Tragic $36,180 |
| Yaqui | 0.0 /100 | #315 | Tragic $36,112 |
| Choctaw | 0.0 /100 | #316 | Tragic $35,999 |
| Dutch West Indians | 0.0 /100 | #317 | Tragic $35,922 |
| Bangladeshis | 0.0 /100 | #318 | Tragic $35,897 |
| Immigrants | Congo | 0.0 /100 | #319 | Tragic $35,720 |
| Hispanics or Latinos | 0.0 /100 | #320 | Tragic $35,688 |
| Blacks/African Americans | 0.0 /100 | #321 | Tragic $35,564 |
| Creek | 0.0 /100 | #322 | Tragic $35,546 |
| Cheyenne | 0.0 /100 | #323 | Tragic $35,276 |
| Kiowa | 0.0 /100 | #324 | Tragic $35,102 |
| Immigrants | Central America | 0.0 /100 | #325 | Tragic $34,974 |
| Immigrants | Cuba | 0.0 /100 | #326 | Tragic $34,910 |
| Apache | 0.0 /100 | #327 | Tragic $34,886 |
| Menominee | 0.0 /100 | #328 | Tragic $34,578 |