European vs Immigrants from Chile Doctorate Degree
COMPARE
European
Immigrants from Chile
Doctorate Degree
Doctorate Degree Comparison
Europeans
Immigrants from Chile
2.1%
DOCTORATE DEGREE
97.5/ 100
METRIC RATING
107th/ 347
METRIC RANK
2.1%
DOCTORATE DEGREE
98.1/ 100
METRIC RATING
102nd/ 347
METRIC RANK
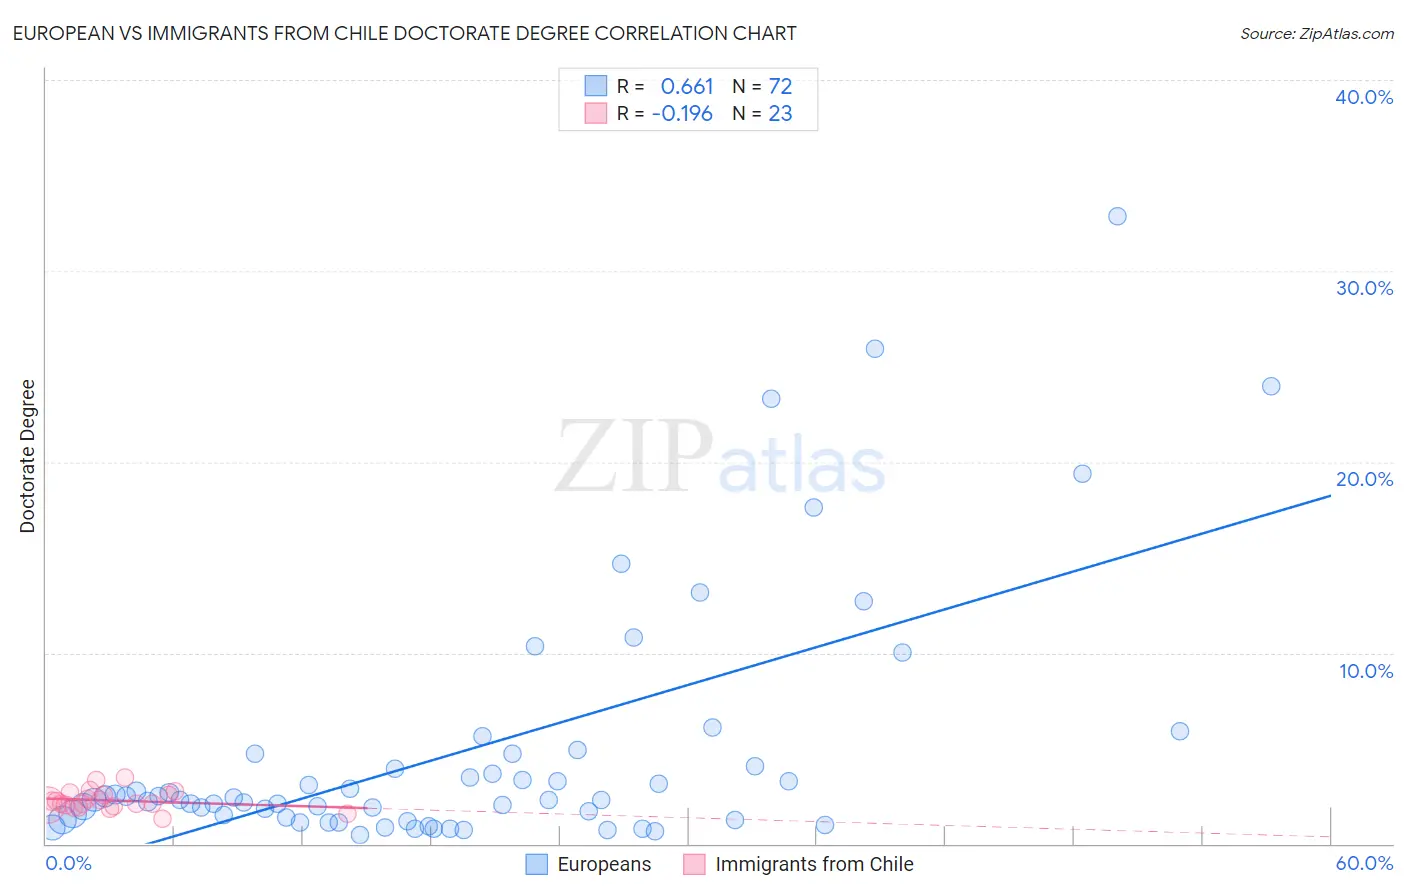
European vs Immigrants from Chile Doctorate Degree Correlation Chart
The statistical analysis conducted on geographies consisting of 540,466,833 people shows a significant positive correlation between the proportion of Europeans and percentage of population with at least doctorate degree education in the United States with a correlation coefficient (R) of 0.661 and weighted average of 2.1%. Similarly, the statistical analysis conducted on geographies consisting of 217,998,165 people shows a poor negative correlation between the proportion of Immigrants from Chile and percentage of population with at least doctorate degree education in the United States with a correlation coefficient (R) of -0.196 and weighted average of 2.1%, a difference of 0.97%.
Doctorate Degree Correlation Summary
| Measurement | European | Immigrants from Chile |
| Minimum | 0.48% | 1.3% |
| Maximum | 32.8% | 3.5% |
| Range | 32.4% | 2.1% |
| Mean | 4.9% | 2.3% |
| Median | 2.3% | 2.1% |
| Interquartile 25% (IQ1) | 1.3% | 2.0% |
| Interquartile 75% (IQ3) | 4.4% | 2.5% |
| Interquartile Range (IQR) | 3.1% | 0.58% |
| Standard Deviation (Sample) | 6.6% | 0.51% |
| Standard Deviation (Population) | 6.6% | 0.50% |
Demographics Similar to Europeans and Immigrants from Chile by Doctorate Degree
In terms of doctorate degree, the demographic groups most similar to Europeans are Immigrants from Germany (2.1%, a difference of 0.22%), Ukrainian (2.1%, a difference of 0.28%), Brazilian (2.1%, a difference of 0.35%), Sudanese (2.1%, a difference of 0.39%), and Immigrants from Pakistan (2.1%, a difference of 0.41%). Similarly, the demographic groups most similar to Immigrants from Chile are Romanian (2.1%, a difference of 0.010%), Austrian (2.1%, a difference of 0.13%), Immigrants from Eastern Africa (2.1%, a difference of 0.22%), Immigrants from Egypt (2.1%, a difference of 0.25%), and Immigrants from Eastern Europe (2.1%, a difference of 0.25%).
| Demographics | Rating | Rank | Doctorate Degree |
| Greeks | 98.8 /100 | #94 | Exceptional 2.1% |
| Immigrants | Romania | 98.7 /100 | #95 | Exceptional 2.1% |
| Immigrants | Northern Africa | 98.4 /100 | #96 | Exceptional 2.1% |
| Immigrants | Eritrea | 98.4 /100 | #97 | Exceptional 2.1% |
| Armenians | 98.3 /100 | #98 | Exceptional 2.1% |
| Immigrants | Egypt | 98.2 /100 | #99 | Exceptional 2.1% |
| Immigrants | Eastern Europe | 98.2 /100 | #100 | Exceptional 2.1% |
| Immigrants | Eastern Africa | 98.2 /100 | #101 | Exceptional 2.1% |
| Immigrants | Chile | 98.1 /100 | #102 | Exceptional 2.1% |
| Romanians | 98.1 /100 | #103 | Exceptional 2.1% |
| Austrians | 98.0 /100 | #104 | Exceptional 2.1% |
| Arabs | 97.8 /100 | #105 | Exceptional 2.1% |
| Sudanese | 97.7 /100 | #106 | Exceptional 2.1% |
| Europeans | 97.5 /100 | #107 | Exceptional 2.1% |
| Immigrants | Germany | 97.3 /100 | #108 | Exceptional 2.1% |
| Ukrainians | 97.2 /100 | #109 | Exceptional 2.1% |
| Brazilians | 97.2 /100 | #110 | Exceptional 2.1% |
| Immigrants | Pakistan | 97.1 /100 | #111 | Exceptional 2.1% |
| Syrians | 97.1 /100 | #112 | Exceptional 2.1% |
| Immigrants | Italy | 96.9 /100 | #113 | Exceptional 2.1% |
| Immigrants | Croatia | 96.8 /100 | #114 | Exceptional 2.1% |