Estonian vs Israeli Single Father Households
COMPARE
Estonian
Israeli
Single Father Households
Single Father Households Comparison
Estonians
Israelis
2.1%
SINGLE FATHER HOUSEHOLDS
99.7/ 100
METRIC RATING
78th/ 347
METRIC RANK
2.0%
SINGLE FATHER HOUSEHOLDS
100.0/ 100
METRIC RATING
31st/ 347
METRIC RANK
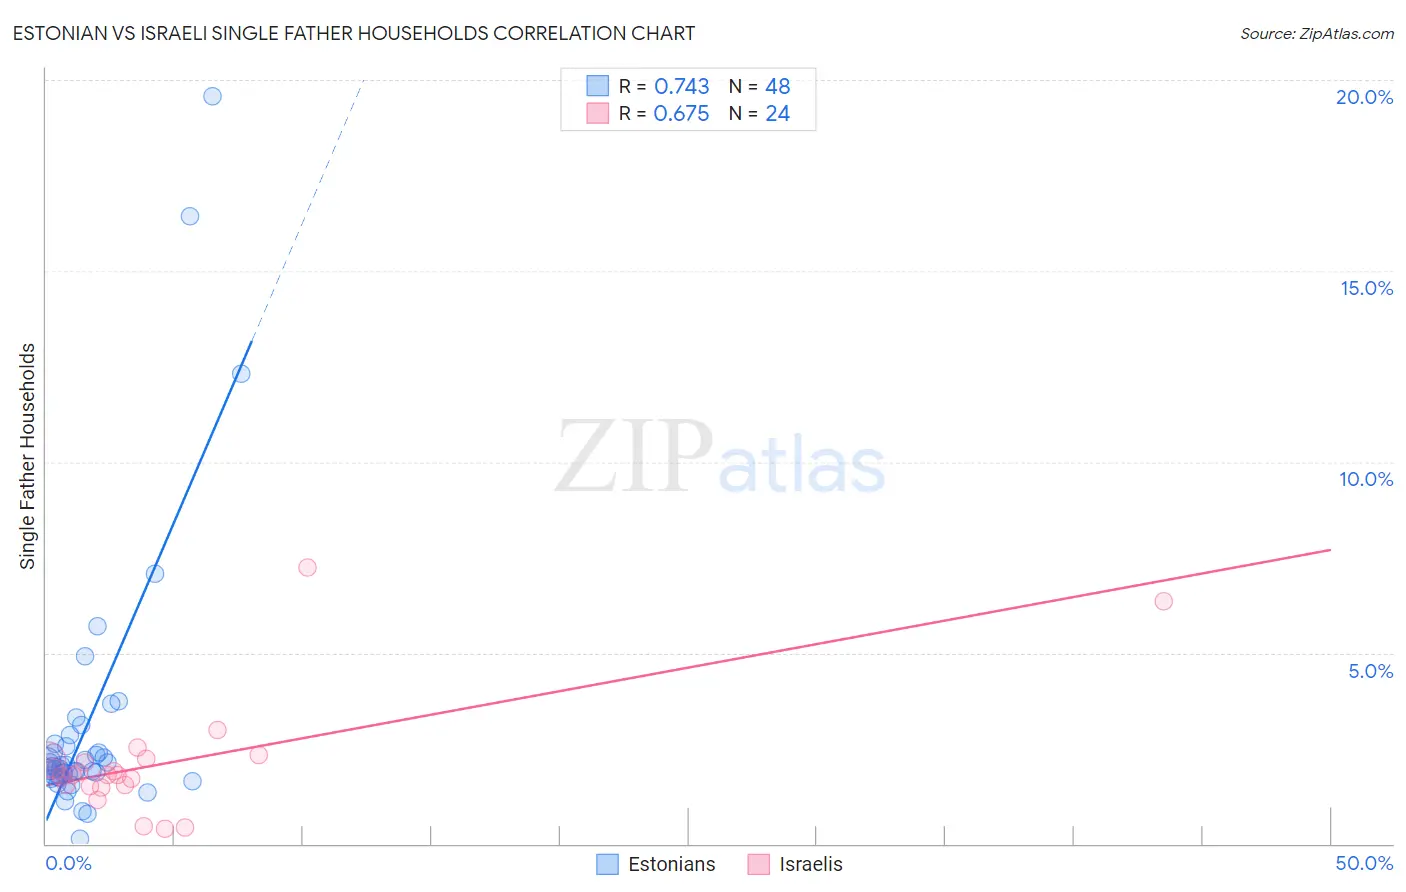
Estonian vs Israeli Single Father Households Correlation Chart
The statistical analysis conducted on geographies consisting of 123,065,759 people shows a strong positive correlation between the proportion of Estonians and percentage of single father households in the United States with a correlation coefficient (R) of 0.743 and weighted average of 2.1%. Similarly, the statistical analysis conducted on geographies consisting of 209,705,406 people shows a significant positive correlation between the proportion of Israelis and percentage of single father households in the United States with a correlation coefficient (R) of 0.675 and weighted average of 2.0%, a difference of 5.7%.
Single Father Households Correlation Summary
| Measurement | Estonian | Israeli |
| Minimum | 0.12% | 0.39% |
| Maximum | 19.6% | 7.2% |
| Range | 19.5% | 6.9% |
| Mean | 3.1% | 2.1% |
| Median | 2.0% | 1.8% |
| Interquartile 25% (IQ1) | 1.8% | 1.5% |
| Interquartile 75% (IQ3) | 2.6% | 2.2% |
| Interquartile Range (IQR) | 0.82% | 0.68% |
| Standard Deviation (Sample) | 3.7% | 1.6% |
| Standard Deviation (Population) | 3.6% | 1.5% |
Similar Demographics by Single Father Households
Demographics Similar to Estonians by Single Father Households
In terms of single father households, the demographic groups most similar to Estonians are Immigrants from Asia (2.1%, a difference of 0.11%), Immigrants from South Africa (2.1%, a difference of 0.20%), Armenian (2.1%, a difference of 0.28%), Immigrants from Saudi Arabia (2.1%, a difference of 0.31%), and New Zealander (2.1%, a difference of 0.33%).
| Demographics | Rating | Rank | Single Father Households |
| Immigrants | Kuwait | 99.8 /100 | #71 | Exceptional 2.1% |
| Immigrants | Spain | 99.8 /100 | #72 | Exceptional 2.1% |
| Immigrants | Bangladesh | 99.8 /100 | #73 | Exceptional 2.1% |
| Immigrants | Egypt | 99.8 /100 | #74 | Exceptional 2.1% |
| Immigrants | Sweden | 99.8 /100 | #75 | Exceptional 2.1% |
| Immigrants | Scotland | 99.8 /100 | #76 | Exceptional 2.1% |
| Immigrants | Saudi Arabia | 99.8 /100 | #77 | Exceptional 2.1% |
| Estonians | 99.7 /100 | #78 | Exceptional 2.1% |
| Immigrants | Asia | 99.7 /100 | #79 | Exceptional 2.1% |
| Immigrants | South Africa | 99.7 /100 | #80 | Exceptional 2.1% |
| Armenians | 99.7 /100 | #81 | Exceptional 2.1% |
| New Zealanders | 99.7 /100 | #82 | Exceptional 2.1% |
| Greeks | 99.7 /100 | #83 | Exceptional 2.1% |
| Carpatho Rusyns | 99.6 /100 | #84 | Exceptional 2.1% |
| Immigrants | Hungary | 99.6 /100 | #85 | Exceptional 2.1% |
Demographics Similar to Israelis by Single Father Households
In terms of single father households, the demographic groups most similar to Israelis are Cambodian (2.0%, a difference of 0.030%), Chinese (2.0%, a difference of 0.040%), Bulgarian (2.0%, a difference of 0.050%), Immigrants from Japan (2.0%, a difference of 0.14%), and Turkish (2.0%, a difference of 0.25%).
| Demographics | Rating | Rank | Single Father Households |
| Immigrants | Russia | 100.0 /100 | #24 | Exceptional 2.0% |
| Eastern Europeans | 100.0 /100 | #25 | Exceptional 2.0% |
| Assyrians/Chaldeans/Syriacs | 100.0 /100 | #26 | Exceptional 2.0% |
| Immigrants | South Central Asia | 100.0 /100 | #27 | Exceptional 2.0% |
| Immigrants | Japan | 100.0 /100 | #28 | Exceptional 2.0% |
| Bulgarians | 100.0 /100 | #29 | Exceptional 2.0% |
| Cambodians | 100.0 /100 | #30 | Exceptional 2.0% |
| Israelis | 100.0 /100 | #31 | Exceptional 2.0% |
| Chinese | 100.0 /100 | #32 | Exceptional 2.0% |
| Turks | 100.0 /100 | #33 | Exceptional 2.0% |
| Immigrants | Australia | 100.0 /100 | #34 | Exceptional 2.0% |
| Albanians | 100.0 /100 | #35 | Exceptional 2.0% |
| Immigrants | Belgium | 100.0 /100 | #36 | Exceptional 2.0% |
| Immigrants | St. Vincent and the Grenadines | 100.0 /100 | #37 | Exceptional 2.0% |
| Immigrants | Eastern Europe | 100.0 /100 | #38 | Exceptional 2.0% |