Estonian vs Immigrants from Kazakhstan Householder Income Over 65 years
COMPARE
Estonian
Immigrants from Kazakhstan
Householder Income Over 65 years
Householder Income Over 65 years Comparison
Estonians
Immigrants from Kazakhstan
$67,926
HOUSEHOLDER INCOME OVER 65 YEARS
99.9/ 100
METRIC RATING
38th/ 347
METRIC RANK
$62,292
HOUSEHOLDER INCOME OVER 65 YEARS
80.0/ 100
METRIC RATING
138th/ 347
METRIC RANK
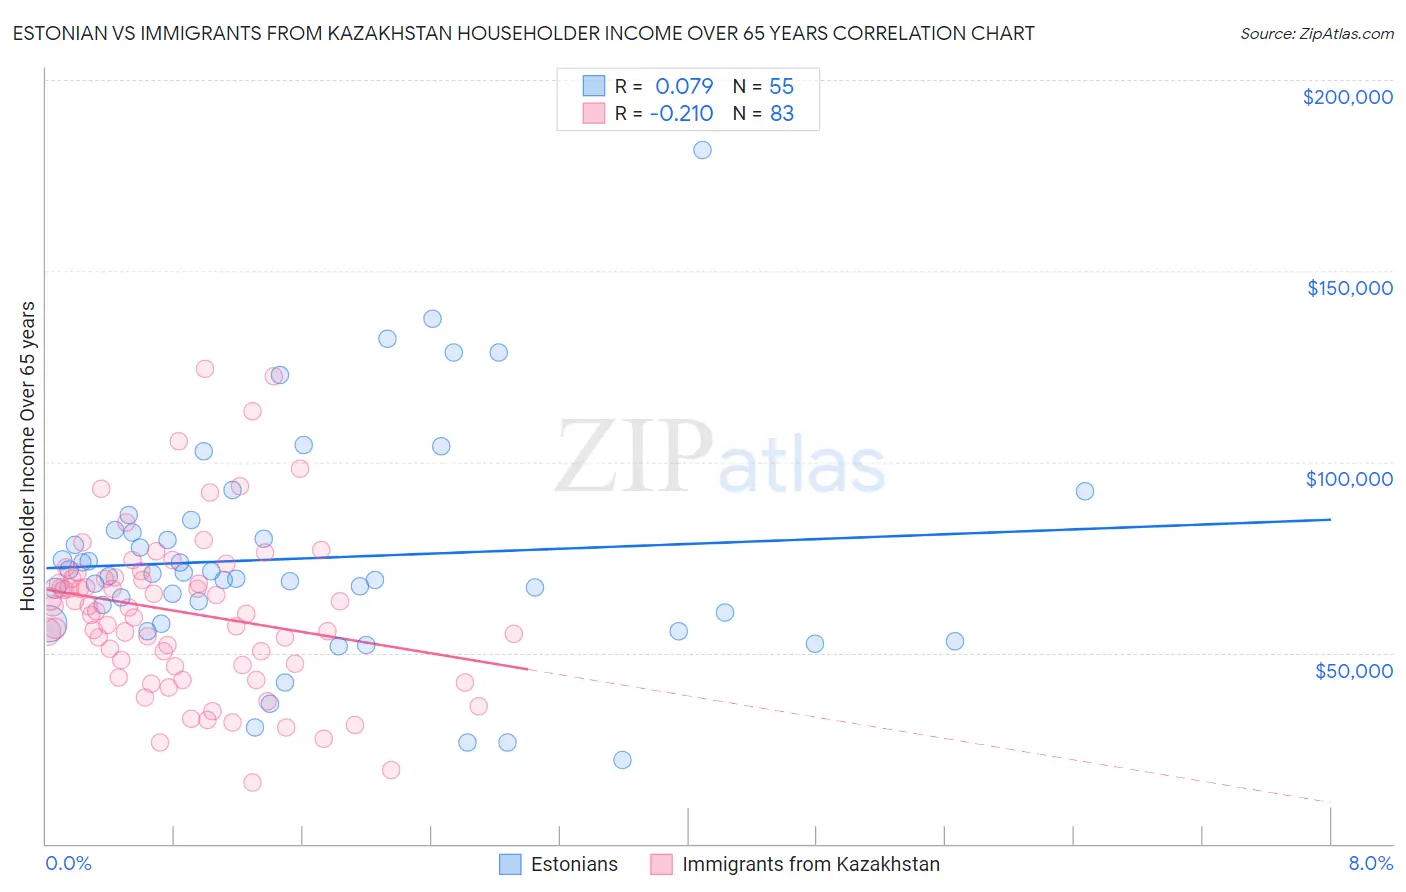
Estonian vs Immigrants from Kazakhstan Householder Income Over 65 years Correlation Chart
The statistical analysis conducted on geographies consisting of 123,423,480 people shows a slight positive correlation between the proportion of Estonians and household income with householder over the age of 65 in the United States with a correlation coefficient (R) of 0.079 and weighted average of $67,926. Similarly, the statistical analysis conducted on geographies consisting of 124,347,353 people shows a weak negative correlation between the proportion of Immigrants from Kazakhstan and household income with householder over the age of 65 in the United States with a correlation coefficient (R) of -0.210 and weighted average of $62,292, a difference of 9.0%.
Householder Income Over 65 years Correlation Summary
| Measurement | Estonian | Immigrants from Kazakhstan |
| Minimum | $21,786 | $16,126 |
| Maximum | $181,719 | $124,402 |
| Range | $159,933 | $108,276 |
| Mean | $74,728 | $60,647 |
| Median | $70,115 | $60,915 |
| Interquartile 25% (IQ1) | $57,743 | $46,912 |
| Interquartile 75% (IQ3) | $82,145 | $69,745 |
| Interquartile Range (IQR) | $24,401 | $22,833 |
| Standard Deviation (Sample) | $29,421 | $21,151 |
| Standard Deviation (Population) | $29,152 | $21,023 |
Similar Demographics by Householder Income Over 65 years
Demographics Similar to Estonians by Householder Income Over 65 years
In terms of householder income over 65 years, the demographic groups most similar to Estonians are Turkish ($68,037, a difference of 0.16%), Immigrants from Austria ($68,208, a difference of 0.42%), Russian ($67,626, a difference of 0.44%), Tongan ($68,235, a difference of 0.46%), and Immigrants from Asia ($67,594, a difference of 0.49%).
| Demographics | Rating | Rank | Householder Income Over 65 years |
| Afghans | 100.0 /100 | #31 | Exceptional $68,951 |
| Asians | 100.0 /100 | #32 | Exceptional $68,822 |
| Immigrants | Denmark | 100.0 /100 | #33 | Exceptional $68,801 |
| Immigrants | Ireland | 100.0 /100 | #34 | Exceptional $68,495 |
| Tongans | 100.0 /100 | #35 | Exceptional $68,235 |
| Immigrants | Austria | 99.9 /100 | #36 | Exceptional $68,208 |
| Turks | 99.9 /100 | #37 | Exceptional $68,037 |
| Estonians | 99.9 /100 | #38 | Exceptional $67,926 |
| Russians | 99.9 /100 | #39 | Exceptional $67,626 |
| Immigrants | Asia | 99.9 /100 | #40 | Exceptional $67,594 |
| Koreans | 99.9 /100 | #41 | Exceptional $67,472 |
| New Zealanders | 99.9 /100 | #42 | Exceptional $67,333 |
| Latvians | 99.9 /100 | #43 | Exceptional $67,326 |
| Immigrants | South Africa | 99.9 /100 | #44 | Exceptional $67,234 |
| Immigrants | Afghanistan | 99.8 /100 | #45 | Exceptional $67,007 |
Demographics Similar to Immigrants from Kazakhstan by Householder Income Over 65 years
In terms of householder income over 65 years, the demographic groups most similar to Immigrants from Kazakhstan are Lebanese ($62,287, a difference of 0.010%), Immigrants from Syria ($62,303, a difference of 0.020%), Arab ($62,266, a difference of 0.040%), Alaskan Athabascan ($62,330, a difference of 0.060%), and Immigrants from Chile ($62,354, a difference of 0.10%).
| Demographics | Rating | Rank | Householder Income Over 65 years |
| Immigrants | Western Asia | 85.3 /100 | #131 | Excellent $62,645 |
| Immigrants | Germany | 83.9 /100 | #132 | Excellent $62,544 |
| Immigrants | Northern Africa | 83.6 /100 | #133 | Excellent $62,522 |
| Immigrants | Brazil | 81.2 /100 | #134 | Excellent $62,364 |
| Immigrants | Chile | 81.0 /100 | #135 | Excellent $62,354 |
| Alaskan Athabascans | 80.6 /100 | #136 | Excellent $62,330 |
| Immigrants | Syria | 80.2 /100 | #137 | Excellent $62,303 |
| Immigrants | Kazakhstan | 80.0 /100 | #138 | Excellent $62,292 |
| Lebanese | 79.9 /100 | #139 | Good $62,287 |
| Arabs | 79.6 /100 | #140 | Good $62,266 |
| Canadians | 79.0 /100 | #141 | Good $62,230 |
| South American Indians | 78.7 /100 | #142 | Good $62,215 |
| Immigrants | Belarus | 77.8 /100 | #143 | Good $62,162 |
| Immigrants | Peru | 74.4 /100 | #144 | Good $61,988 |
| Immigrants | Uganda | 74.2 /100 | #145 | Good $61,976 |