Estonian vs Immigrants from Bangladesh Median Earnings
COMPARE
Estonian
Immigrants from Bangladesh
Median Earnings
Median Earnings Comparison
Estonians
Immigrants from Bangladesh
$51,772
MEDIAN EARNINGS
99.9/ 100
METRIC RATING
52nd/ 347
METRIC RANK
$45,532
MEDIAN EARNINGS
22.0/ 100
METRIC RATING
215th/ 347
METRIC RANK
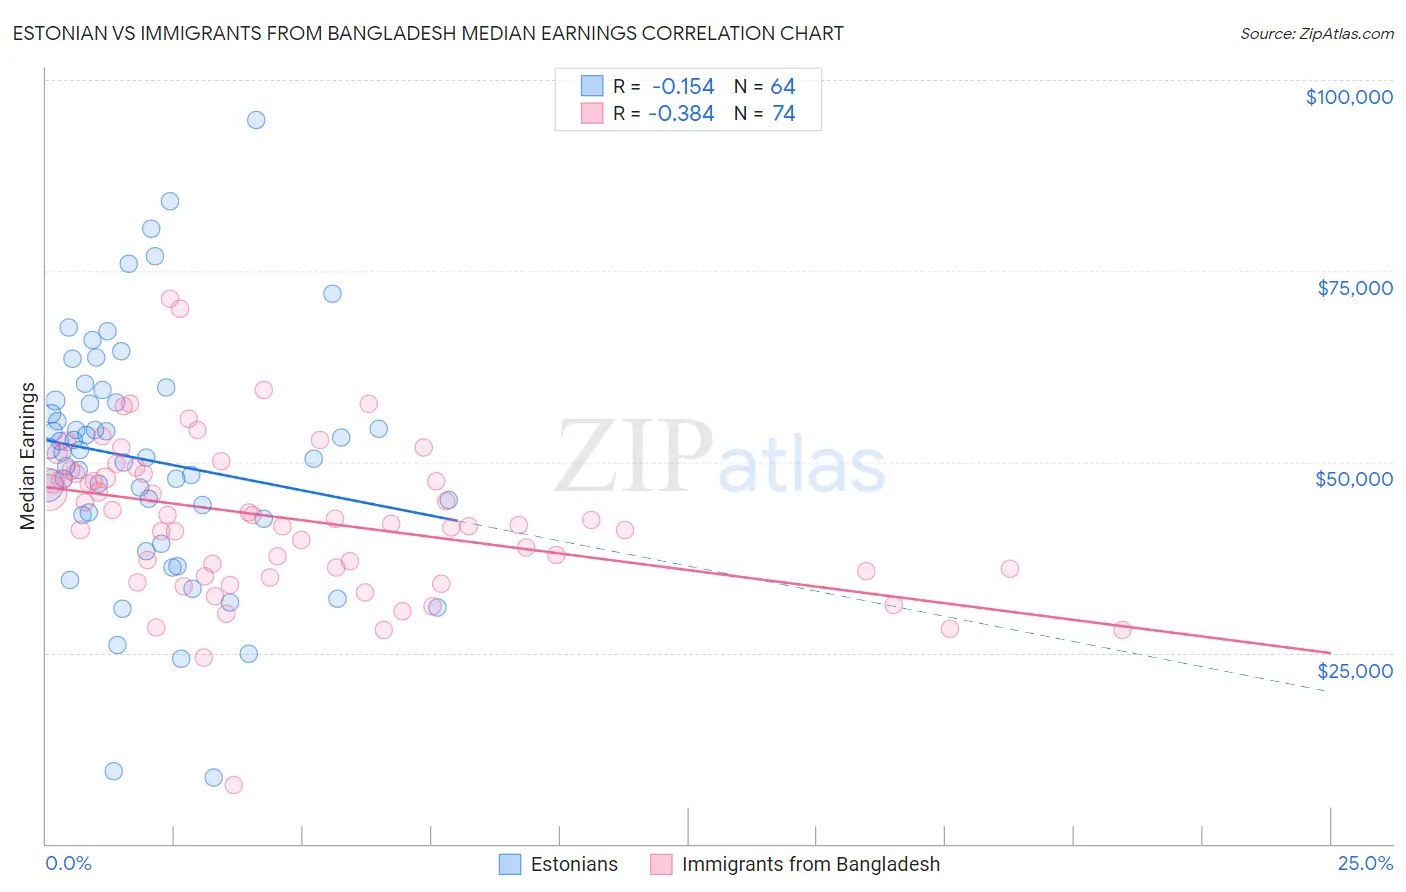
Estonian vs Immigrants from Bangladesh Median Earnings Correlation Chart
The statistical analysis conducted on geographies consisting of 123,525,631 people shows a poor negative correlation between the proportion of Estonians and median earnings in the United States with a correlation coefficient (R) of -0.154 and weighted average of $51,772. Similarly, the statistical analysis conducted on geographies consisting of 203,670,623 people shows a mild negative correlation between the proportion of Immigrants from Bangladesh and median earnings in the United States with a correlation coefficient (R) of -0.384 and weighted average of $45,532, a difference of 13.7%.
Median Earnings Correlation Summary
| Measurement | Estonian | Immigrants from Bangladesh |
| Minimum | $8,672 | $7,703 |
| Maximum | $94,792 | $71,366 |
| Range | $86,120 | $63,663 |
| Mean | $50,194 | $42,517 |
| Median | $50,958 | $42,193 |
| Interquartile 25% (IQ1) | $42,740 | $35,657 |
| Interquartile 75% (IQ3) | $57,865 | $48,515 |
| Interquartile Range (IQR) | $15,125 | $12,858 |
| Standard Deviation (Sample) | $15,990 | $10,295 |
| Standard Deviation (Population) | $15,865 | $10,225 |
Similar Demographics by Median Earnings
Demographics Similar to Estonians by Median Earnings
In terms of median earnings, the demographic groups most similar to Estonians are Immigrants from Norway ($51,758, a difference of 0.030%), Immigrants from Austria ($51,826, a difference of 0.10%), Immigrants from Indonesia ($51,715, a difference of 0.11%), Egyptian ($51,701, a difference of 0.14%), and Immigrants from South Africa ($51,850, a difference of 0.15%).
| Demographics | Rating | Rank | Median Earnings |
| Immigrants | Czechoslovakia | 100.0 /100 | #45 | Exceptional $52,361 |
| Bhutanese | 100.0 /100 | #46 | Exceptional $52,297 |
| Australians | 100.0 /100 | #47 | Exceptional $52,294 |
| Immigrants | Europe | 100.0 /100 | #48 | Exceptional $52,195 |
| Bolivians | 100.0 /100 | #49 | Exceptional $52,005 |
| Immigrants | South Africa | 100.0 /100 | #50 | Exceptional $51,850 |
| Immigrants | Austria | 99.9 /100 | #51 | Exceptional $51,826 |
| Estonians | 99.9 /100 | #52 | Exceptional $51,772 |
| Immigrants | Norway | 99.9 /100 | #53 | Exceptional $51,758 |
| Immigrants | Indonesia | 99.9 /100 | #54 | Exceptional $51,715 |
| Egyptians | 99.9 /100 | #55 | Exceptional $51,701 |
| Immigrants | Pakistan | 99.9 /100 | #56 | Exceptional $51,693 |
| Immigrants | Eastern Europe | 99.9 /100 | #57 | Exceptional $51,624 |
| Immigrants | Bolivia | 99.9 /100 | #58 | Exceptional $51,605 |
| Immigrants | Croatia | 99.9 /100 | #59 | Exceptional $51,581 |
Demographics Similar to Immigrants from Bangladesh by Median Earnings
In terms of median earnings, the demographic groups most similar to Immigrants from Bangladesh are Nigerian ($45,532, a difference of 0.0%), Immigrants from Colombia ($45,550, a difference of 0.040%), Panamanian ($45,593, a difference of 0.13%), Bermudan ($45,593, a difference of 0.13%), and Immigrants from Grenada ($45,596, a difference of 0.14%).
| Demographics | Rating | Rank | Median Earnings |
| Immigrants | Bosnia and Herzegovina | 23.7 /100 | #208 | Fair $45,600 |
| Immigrants | Thailand | 23.7 /100 | #209 | Fair $45,598 |
| Immigrants | Grenada | 23.6 /100 | #210 | Fair $45,596 |
| Panamanians | 23.5 /100 | #211 | Fair $45,593 |
| Bermudans | 23.5 /100 | #212 | Fair $45,593 |
| Immigrants | Colombia | 22.4 /100 | #213 | Fair $45,550 |
| Nigerians | 22.0 /100 | #214 | Fair $45,532 |
| Immigrants | Bangladesh | 22.0 /100 | #215 | Fair $45,532 |
| Guyanese | 20.6 /100 | #216 | Fair $45,470 |
| Tlingit-Haida | 20.5 /100 | #217 | Fair $45,468 |
| Spanish | 19.7 /100 | #218 | Poor $45,432 |
| Dutch | 18.4 /100 | #219 | Poor $45,370 |
| Ecuadorians | 15.3 /100 | #220 | Poor $45,214 |
| Immigrants | Guyana | 15.1 /100 | #221 | Poor $45,204 |
| Immigrants | Panama | 15.0 /100 | #222 | Poor $45,198 |