English vs Taiwanese Per Capita Income
COMPARE
English
Taiwanese
Per Capita Income
Per Capita Income Comparison
English
Taiwanese
$43,982
PER CAPITA INCOME
58.9/ 100
METRIC RATING
167th/ 347
METRIC RANK
$46,455
PER CAPITA INCOME
95.8/ 100
METRIC RATING
111th/ 347
METRIC RANK
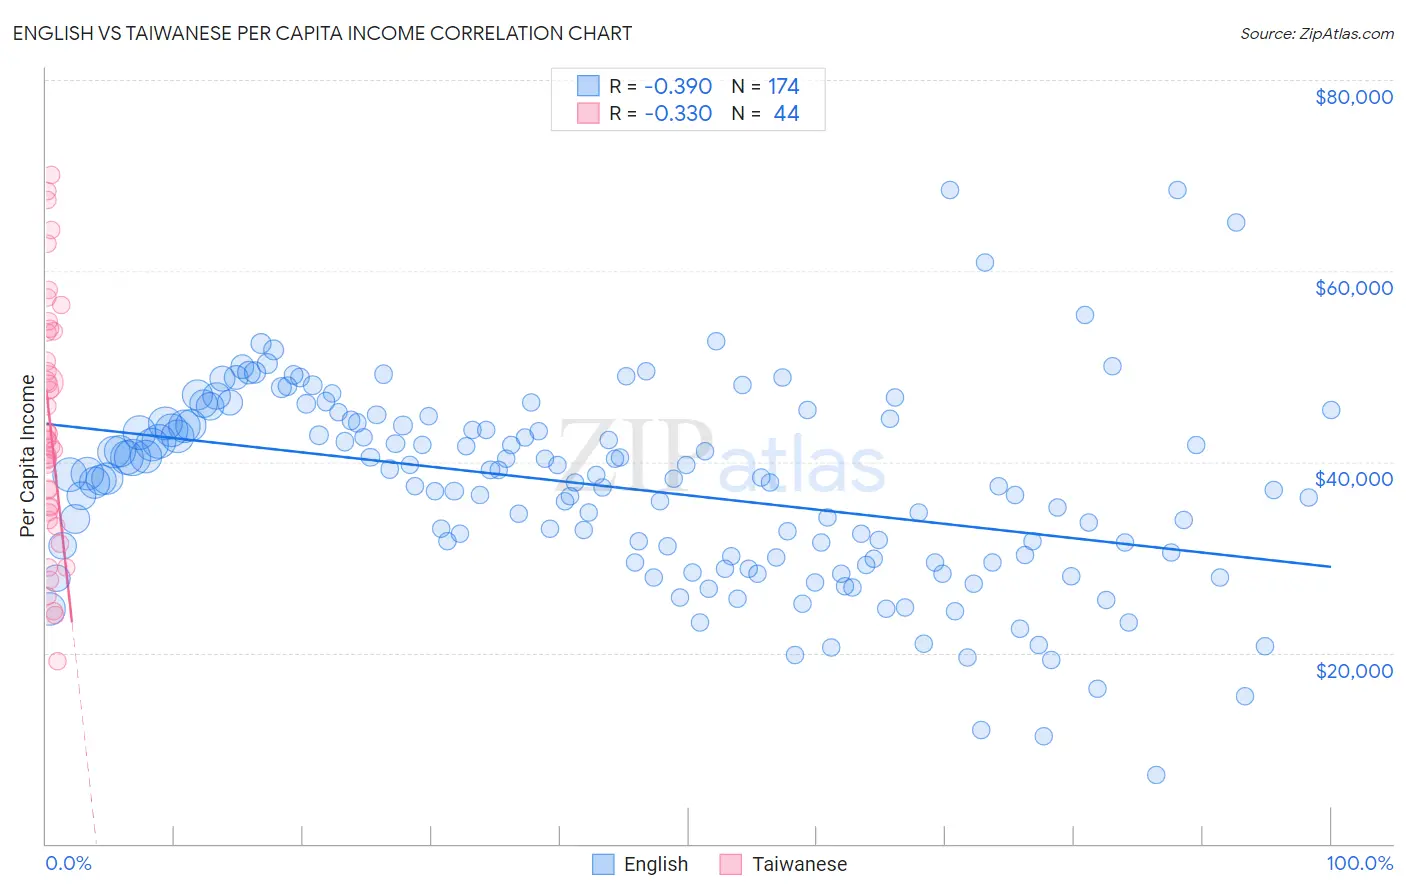
English vs Taiwanese Per Capita Income Correlation Chart
The statistical analysis conducted on geographies consisting of 580,041,700 people shows a mild negative correlation between the proportion of English and per capita income in the United States with a correlation coefficient (R) of -0.390 and weighted average of $43,982. Similarly, the statistical analysis conducted on geographies consisting of 31,724,936 people shows a mild negative correlation between the proportion of Taiwanese and per capita income in the United States with a correlation coefficient (R) of -0.330 and weighted average of $46,455, a difference of 5.6%.
Per Capita Income Correlation Summary
| Measurement | English | Taiwanese |
| Minimum | $7,241 | $19,108 |
| Maximum | $68,486 | $70,046 |
| Range | $61,245 | $50,938 |
| Mean | $37,333 | $43,880 |
| Median | $38,254 | $42,360 |
| Interquartile 25% (IQ1) | $30,036 | $34,944 |
| Interquartile 75% (IQ3) | $44,055 | $53,629 |
| Interquartile Range (IQR) | $14,019 | $18,684 |
| Standard Deviation (Sample) | $10,214 | $12,658 |
| Standard Deviation (Population) | $10,184 | $12,514 |
Similar Demographics by Per Capita Income
Demographics Similar to English by Per Capita Income
In terms of per capita income, the demographic groups most similar to English are Immigrants from Uruguay ($43,997, a difference of 0.030%), Immigrants from Philippines ($44,000, a difference of 0.040%), Sri Lankan ($44,014, a difference of 0.070%), Belgian ($43,951, a difference of 0.070%), and Immigrants from South America ($44,068, a difference of 0.19%).
| Demographics | Rating | Rank | Per Capita Income |
| Danes | 61.9 /100 | #160 | Good $44,095 |
| Costa Ricans | 61.8 /100 | #161 | Good $44,090 |
| Swiss | 61.4 /100 | #162 | Good $44,076 |
| Immigrants | South America | 61.2 /100 | #163 | Good $44,068 |
| Sri Lankans | 59.8 /100 | #164 | Average $44,014 |
| Immigrants | Philippines | 59.4 /100 | #165 | Average $44,000 |
| Immigrants | Uruguay | 59.3 /100 | #166 | Average $43,997 |
| English | 58.9 /100 | #167 | Average $43,982 |
| Belgians | 58.1 /100 | #168 | Average $43,951 |
| Immigrants | Peru | 55.3 /100 | #169 | Average $43,852 |
| Scandinavians | 55.2 /100 | #170 | Average $43,848 |
| Immigrants | Eastern Africa | 54.9 /100 | #171 | Average $43,838 |
| Czechoslovakians | 54.1 /100 | #172 | Average $43,806 |
| French | 50.7 /100 | #173 | Average $43,685 |
| Colombians | 50.0 /100 | #174 | Average $43,661 |
Demographics Similar to Taiwanese by Per Capita Income
In terms of per capita income, the demographic groups most similar to Taiwanese are Chilean ($46,459, a difference of 0.010%), Immigrants from Morocco ($46,430, a difference of 0.050%), Immigrants from Albania ($46,387, a difference of 0.14%), Immigrants from Northern Africa ($46,531, a difference of 0.16%), and Immigrants from Kuwait ($46,543, a difference of 0.19%).
| Demographics | Rating | Rank | Per Capita Income |
| Brazilians | 96.8 /100 | #104 | Exceptional $46,700 |
| British | 96.3 /100 | #105 | Exceptional $46,571 |
| Ethiopians | 96.3 /100 | #106 | Exceptional $46,569 |
| Serbians | 96.2 /100 | #107 | Exceptional $46,551 |
| Immigrants | Kuwait | 96.2 /100 | #108 | Exceptional $46,543 |
| Immigrants | Northern Africa | 96.2 /100 | #109 | Exceptional $46,531 |
| Chileans | 95.9 /100 | #110 | Exceptional $46,459 |
| Taiwanese | 95.8 /100 | #111 | Exceptional $46,455 |
| Immigrants | Morocco | 95.7 /100 | #112 | Exceptional $46,430 |
| Immigrants | Albania | 95.5 /100 | #113 | Exceptional $46,387 |
| Afghans | 94.9 /100 | #114 | Exceptional $46,268 |
| Immigrants | Chile | 94.6 /100 | #115 | Exceptional $46,213 |
| Poles | 94.1 /100 | #116 | Exceptional $46,123 |
| Chinese | 93.9 /100 | #117 | Exceptional $46,098 |
| Immigrants | Saudi Arabia | 93.3 /100 | #118 | Exceptional $46,008 |