English vs Immigrants from Taiwan Median Household Income
COMPARE
English
Immigrants from Taiwan
Median Household Income
Median Household Income Comparison
English
Immigrants from Taiwan
$84,915
MEDIAN HOUSEHOLD INCOME
47.0/ 100
METRIC RATING
179th/ 347
METRIC RANK
$116,460
MEDIAN HOUSEHOLD INCOME
100.0/ 100
METRIC RATING
1st/ 347
METRIC RANK
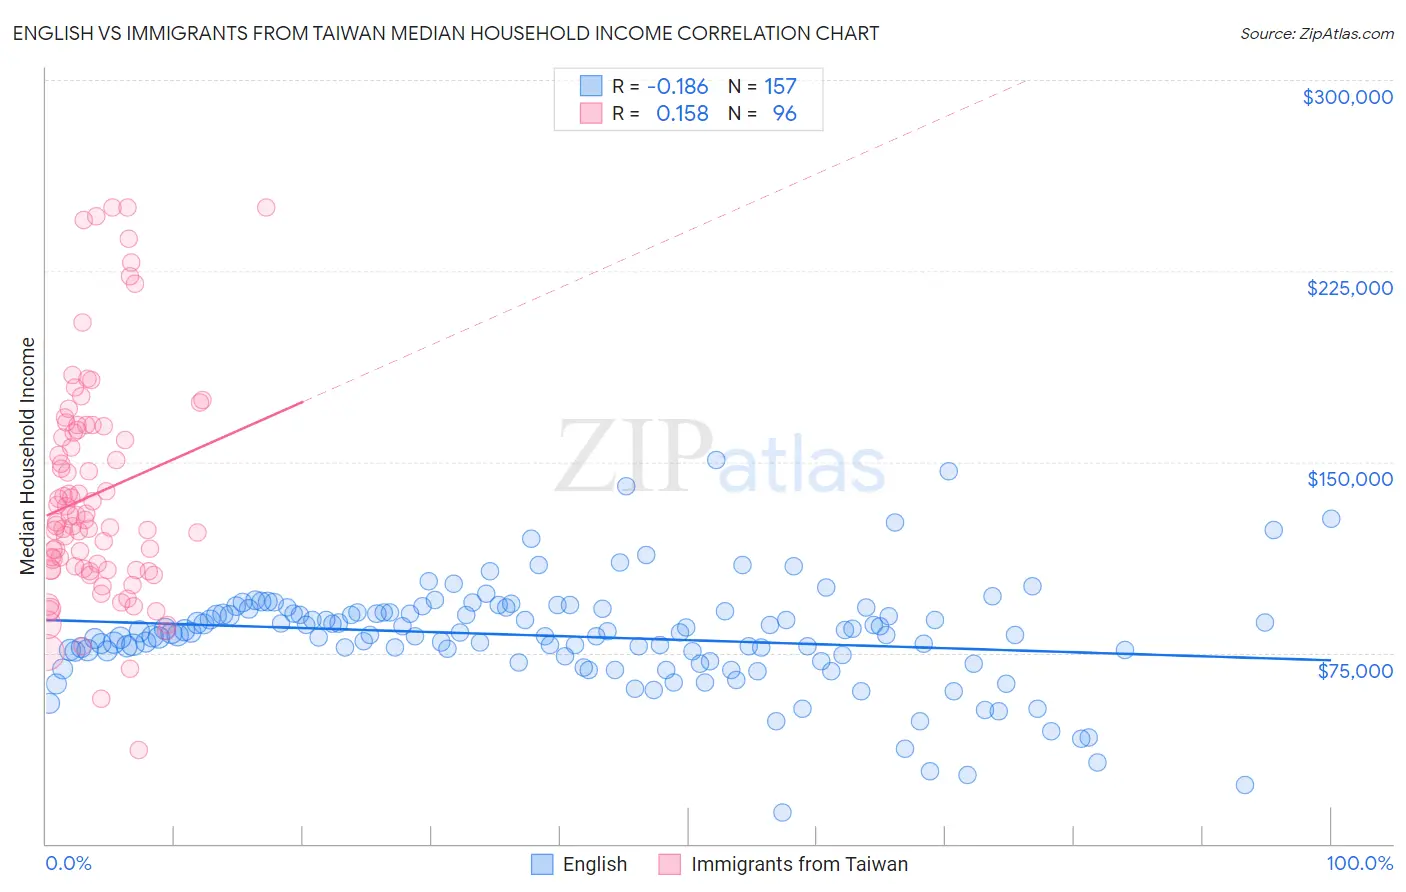
English vs Immigrants from Taiwan Median Household Income Correlation Chart
The statistical analysis conducted on geographies consisting of 578,383,901 people shows a poor negative correlation between the proportion of English and median household income in the United States with a correlation coefficient (R) of -0.186 and weighted average of $84,915. Similarly, the statistical analysis conducted on geographies consisting of 298,086,025 people shows a poor positive correlation between the proportion of Immigrants from Taiwan and median household income in the United States with a correlation coefficient (R) of 0.158 and weighted average of $116,460, a difference of 37.1%.
Median Household Income Correlation Summary
| Measurement | English | Immigrants from Taiwan |
| Minimum | $12,326 | $37,017 |
| Maximum | $150,805 | $250,001 |
| Range | $138,479 | $212,984 |
| Mean | $81,510 | $137,283 |
| Median | $82,609 | $126,701 |
| Interquartile 25% (IQ1) | $73,869 | $107,640 |
| Interquartile 75% (IQ3) | $90,807 | $163,259 |
| Interquartile Range (IQR) | $16,938 | $55,619 |
| Standard Deviation (Sample) | $20,635 | $44,785 |
| Standard Deviation (Population) | $20,569 | $44,551 |
Similar Demographics by Median Household Income
Demographics Similar to English by Median Household Income
In terms of median household income, the demographic groups most similar to English are Czechoslovakian ($84,965, a difference of 0.060%), Immigrants from Eritrea ($85,025, a difference of 0.13%), Immigrants from Costa Rica ($85,054, a difference of 0.16%), Alsatian ($85,053, a difference of 0.16%), and Immigrants from Portugal ($84,740, a difference of 0.21%).
| Demographics | Rating | Rank | Median Household Income |
| Slovenes | 57.4 /100 | #172 | Average $85,562 |
| Immigrants | Cameroon | 53.4 /100 | #173 | Average $85,314 |
| Scottish | 50.0 /100 | #174 | Average $85,101 |
| Immigrants | Costa Rica | 49.2 /100 | #175 | Average $85,054 |
| Alsatians | 49.2 /100 | #176 | Average $85,053 |
| Immigrants | Eritrea | 48.8 /100 | #177 | Average $85,025 |
| Czechoslovakians | 47.8 /100 | #178 | Average $84,965 |
| English | 47.0 /100 | #179 | Average $84,915 |
| Immigrants | Portugal | 44.2 /100 | #180 | Average $84,740 |
| Hawaiians | 44.1 /100 | #181 | Average $84,729 |
| Uruguayans | 43.5 /100 | #182 | Average $84,691 |
| Spaniards | 42.7 /100 | #183 | Average $84,644 |
| Immigrants | Eastern Africa | 37.4 /100 | #184 | Fair $84,299 |
| Kenyans | 34.2 /100 | #185 | Fair $84,085 |
| Puget Sound Salish | 33.2 /100 | #186 | Fair $84,011 |
Demographics Similar to Immigrants from Taiwan by Median Household Income
In terms of median household income, the demographic groups most similar to Immigrants from Taiwan are Filipino ($115,509, a difference of 0.82%), Immigrants from India ($113,009, a difference of 3.0%), Immigrants from Hong Kong ($111,519, a difference of 4.4%), Thai ($110,648, a difference of 5.2%), and Immigrants from Singapore ($110,428, a difference of 5.5%).
| Demographics | Rating | Rank | Median Household Income |
| Immigrants | Taiwan | 100.0 /100 | #1 | Exceptional $116,460 |
| Filipinos | 100.0 /100 | #2 | Exceptional $115,509 |
| Immigrants | India | 100.0 /100 | #3 | Exceptional $113,009 |
| Immigrants | Hong Kong | 100.0 /100 | #4 | Exceptional $111,519 |
| Thais | 100.0 /100 | #5 | Exceptional $110,648 |
| Immigrants | Singapore | 100.0 /100 | #6 | Exceptional $110,428 |
| Iranians | 100.0 /100 | #7 | Exceptional $109,835 |
| Immigrants | Iran | 100.0 /100 | #8 | Exceptional $108,055 |
| Okinawans | 100.0 /100 | #9 | Exceptional $106,624 |
| Immigrants | South Central Asia | 100.0 /100 | #10 | Exceptional $106,057 |
| Immigrants | China | 100.0 /100 | #11 | Exceptional $105,335 |
| Indians (Asian) | 100.0 /100 | #12 | Exceptional $105,262 |
| Immigrants | Eastern Asia | 100.0 /100 | #13 | Exceptional $104,796 |
| Immigrants | Ireland | 100.0 /100 | #14 | Exceptional $104,692 |
| Immigrants | Israel | 100.0 /100 | #15 | Exceptional $104,090 |