Egyptian vs Immigrants from Lebanon Per Capita Income
COMPARE
Egyptian
Immigrants from Lebanon
Per Capita Income
Per Capita Income Comparison
Egyptians
Immigrants from Lebanon
$48,358
PER CAPITA INCOME
99.5/ 100
METRIC RATING
80th/ 347
METRIC RANK
$46,938
PER CAPITA INCOME
97.5/ 100
METRIC RATING
100th/ 347
METRIC RANK
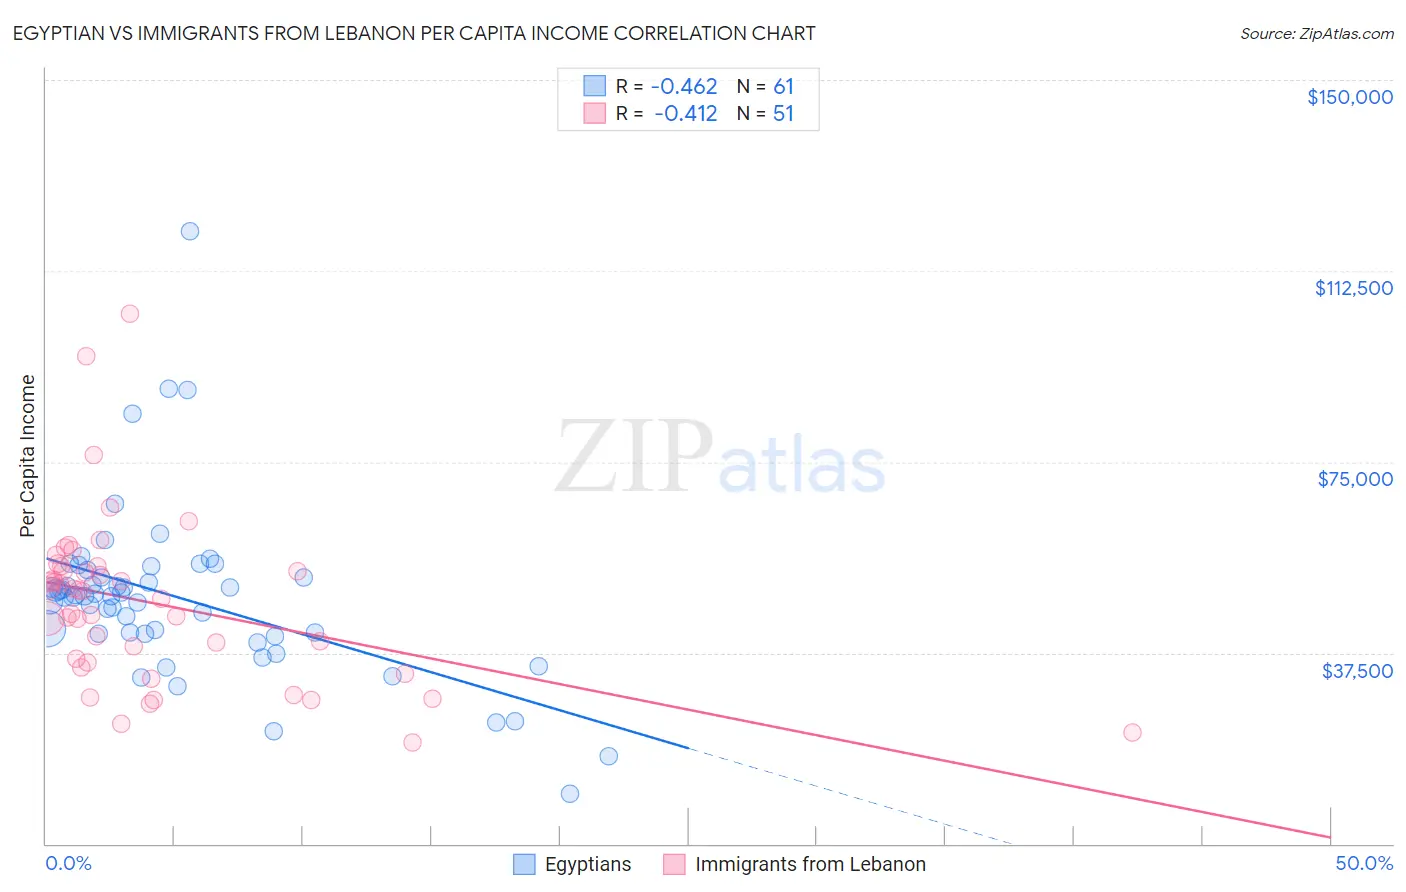
Egyptian vs Immigrants from Lebanon Per Capita Income Correlation Chart
The statistical analysis conducted on geographies consisting of 276,936,692 people shows a moderate negative correlation between the proportion of Egyptians and per capita income in the United States with a correlation coefficient (R) of -0.462 and weighted average of $48,358. Similarly, the statistical analysis conducted on geographies consisting of 217,160,292 people shows a moderate negative correlation between the proportion of Immigrants from Lebanon and per capita income in the United States with a correlation coefficient (R) of -0.412 and weighted average of $46,938, a difference of 3.0%.
Per Capita Income Correlation Summary
| Measurement | Egyptian | Immigrants from Lebanon |
| Minimum | $9,805 | $19,973 |
| Maximum | $120,225 | $104,134 |
| Range | $110,420 | $84,161 |
| Mean | $48,391 | $47,317 |
| Median | $48,690 | $49,588 |
| Interquartile 25% (IQ1) | $41,170 | $35,701 |
| Interquartile 75% (IQ3) | $53,076 | $54,451 |
| Interquartile Range (IQR) | $11,906 | $18,750 |
| Standard Deviation (Sample) | $16,881 | $16,286 |
| Standard Deviation (Population) | $16,742 | $16,125 |
Demographics Similar to Egyptians and Immigrants from Lebanon by Per Capita Income
In terms of per capita income, the demographic groups most similar to Egyptians are Armenian ($48,287, a difference of 0.15%), Immigrants from Indonesia ($48,195, a difference of 0.34%), Immigrants from Brazil ($48,164, a difference of 0.40%), Immigrants from Ukraine ($48,134, a difference of 0.46%), and Austrian ($48,116, a difference of 0.50%). Similarly, the demographic groups most similar to Immigrants from Lebanon are Laotian ($47,041, a difference of 0.22%), Immigrants from Pakistan ($47,084, a difference of 0.31%), Carpatho Rusyn ($47,248, a difference of 0.66%), Alsatian ($47,284, a difference of 0.74%), and Immigrants from Egypt ($47,361, a difference of 0.90%).
| Demographics | Rating | Rank | Per Capita Income |
| Egyptians | 99.5 /100 | #80 | Exceptional $48,358 |
| Armenians | 99.4 /100 | #81 | Exceptional $48,287 |
| Immigrants | Indonesia | 99.4 /100 | #82 | Exceptional $48,195 |
| Immigrants | Brazil | 99.4 /100 | #83 | Exceptional $48,164 |
| Immigrants | Ukraine | 99.3 /100 | #84 | Exceptional $48,134 |
| Austrians | 99.3 /100 | #85 | Exceptional $48,116 |
| Immigrants | Southern Europe | 99.3 /100 | #86 | Exceptional $48,027 |
| Ukrainians | 99.3 /100 | #87 | Exceptional $48,014 |
| Croatians | 99.0 /100 | #88 | Exceptional $47,742 |
| Northern Europeans | 98.9 /100 | #89 | Exceptional $47,698 |
| Italians | 98.8 /100 | #90 | Exceptional $47,574 |
| Macedonians | 98.8 /100 | #91 | Exceptional $47,573 |
| Immigrants | Moldova | 98.7 /100 | #92 | Exceptional $47,489 |
| Immigrants | Zimbabwe | 98.5 /100 | #93 | Exceptional $47,394 |
| Albanians | 98.5 /100 | #94 | Exceptional $47,379 |
| Immigrants | Egypt | 98.5 /100 | #95 | Exceptional $47,361 |
| Alsatians | 98.3 /100 | #96 | Exceptional $47,284 |
| Carpatho Rusyns | 98.2 /100 | #97 | Exceptional $47,248 |
| Immigrants | Pakistan | 97.9 /100 | #98 | Exceptional $47,084 |
| Laotians | 97.8 /100 | #99 | Exceptional $47,041 |
| Immigrants | Lebanon | 97.5 /100 | #100 | Exceptional $46,938 |