Egyptian vs Immigrants from Uganda Per Capita Income
COMPARE
Egyptian
Immigrants from Uganda
Per Capita Income
Per Capita Income Comparison
Egyptians
Immigrants from Uganda
$48,358
PER CAPITA INCOME
99.5/ 100
METRIC RATING
80th/ 347
METRIC RANK
$45,043
PER CAPITA INCOME
82.5/ 100
METRIC RATING
143rd/ 347
METRIC RANK
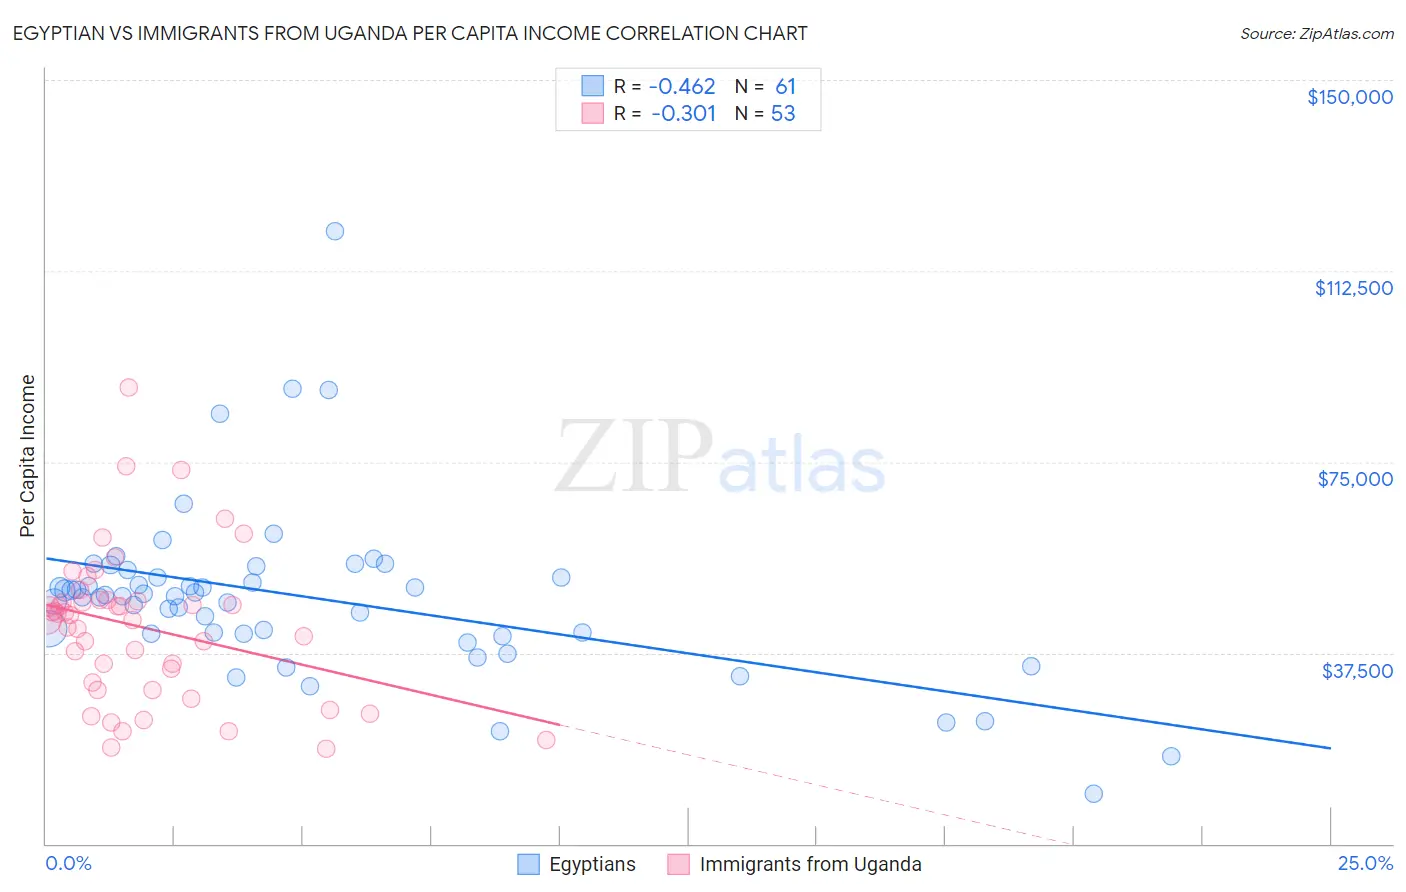
Egyptian vs Immigrants from Uganda Per Capita Income Correlation Chart
The statistical analysis conducted on geographies consisting of 276,936,692 people shows a moderate negative correlation between the proportion of Egyptians and per capita income in the United States with a correlation coefficient (R) of -0.462 and weighted average of $48,358. Similarly, the statistical analysis conducted on geographies consisting of 125,982,219 people shows a mild negative correlation between the proportion of Immigrants from Uganda and per capita income in the United States with a correlation coefficient (R) of -0.301 and weighted average of $45,043, a difference of 7.4%.
Per Capita Income Correlation Summary
| Measurement | Egyptian | Immigrants from Uganda |
| Minimum | $9,805 | $18,741 |
| Maximum | $120,225 | $89,561 |
| Range | $110,420 | $70,820 |
| Mean | $48,391 | $42,540 |
| Median | $48,690 | $45,016 |
| Interquartile 25% (IQ1) | $41,170 | $30,934 |
| Interquartile 75% (IQ3) | $53,076 | $47,740 |
| Interquartile Range (IQR) | $11,906 | $16,806 |
| Standard Deviation (Sample) | $16,881 | $14,536 |
| Standard Deviation (Population) | $16,742 | $14,398 |
Similar Demographics by Per Capita Income
Demographics Similar to Egyptians by Per Capita Income
In terms of per capita income, the demographic groups most similar to Egyptians are Armenian ($48,287, a difference of 0.15%), Romanian ($48,445, a difference of 0.18%), Immigrants from Indonesia ($48,195, a difference of 0.34%), Immigrants from Brazil ($48,164, a difference of 0.40%), and Immigrants from Ukraine ($48,134, a difference of 0.46%).
| Demographics | Rating | Rank | Per Capita Income |
| Immigrants | North America | 99.8 /100 | #73 | Exceptional $49,302 |
| Mongolians | 99.8 /100 | #74 | Exceptional $49,173 |
| Immigrants | Bolivia | 99.7 /100 | #75 | Exceptional $48,970 |
| Immigrants | England | 99.7 /100 | #76 | Exceptional $48,844 |
| Immigrants | Kazakhstan | 99.7 /100 | #77 | Exceptional $48,747 |
| Immigrants | Italy | 99.6 /100 | #78 | Exceptional $48,654 |
| Romanians | 99.5 /100 | #79 | Exceptional $48,445 |
| Egyptians | 99.5 /100 | #80 | Exceptional $48,358 |
| Armenians | 99.4 /100 | #81 | Exceptional $48,287 |
| Immigrants | Indonesia | 99.4 /100 | #82 | Exceptional $48,195 |
| Immigrants | Brazil | 99.4 /100 | #83 | Exceptional $48,164 |
| Immigrants | Ukraine | 99.3 /100 | #84 | Exceptional $48,134 |
| Austrians | 99.3 /100 | #85 | Exceptional $48,116 |
| Immigrants | Southern Europe | 99.3 /100 | #86 | Exceptional $48,027 |
| Ukrainians | 99.3 /100 | #87 | Exceptional $48,014 |
Demographics Similar to Immigrants from Uganda by Per Capita Income
In terms of per capita income, the demographic groups most similar to Immigrants from Uganda are Slavic ($45,049, a difference of 0.010%), Ugandan ($45,047, a difference of 0.010%), Immigrants from Jordan ($45,066, a difference of 0.050%), Basque ($45,086, a difference of 0.10%), and Icelander ($44,987, a difference of 0.12%).
| Demographics | Rating | Rank | Per Capita Income |
| Immigrants | Oceania | 85.2 /100 | #136 | Excellent $45,220 |
| Immigrants | Syria | 85.2 /100 | #137 | Excellent $45,218 |
| Assyrians/Chaldeans/Syriacs | 84.8 /100 | #138 | Excellent $45,195 |
| Basques | 83.2 /100 | #139 | Excellent $45,086 |
| Immigrants | Jordan | 82.9 /100 | #140 | Excellent $45,066 |
| Slavs | 82.6 /100 | #141 | Excellent $45,049 |
| Ugandans | 82.6 /100 | #142 | Excellent $45,047 |
| Immigrants | Uganda | 82.5 /100 | #143 | Excellent $45,043 |
| Icelanders | 81.6 /100 | #144 | Excellent $44,987 |
| Immigrants | Afghanistan | 78.0 /100 | #145 | Good $44,790 |
| Irish | 75.8 /100 | #146 | Good $44,679 |
| Czechs | 74.1 /100 | #147 | Good $44,595 |
| Immigrants | Armenia | 73.1 /100 | #148 | Good $44,552 |
| Koreans | 72.5 /100 | #149 | Good $44,522 |
| Immigrants | Eritrea | 72.1 /100 | #150 | Good $44,509 |