Bhutanese vs Immigrants from Belgium Median Household Income

COMPARE

Bhutanese
Race
Ancestry
AfghanAfricanAlaska NativeAlaskan AthabascanAlbanianAleutAlsatianAmericanApacheArabArapahoArgentineanArmenianAssyrian/Chaldean/SyriacAustralianAustrianBahamianBangladeshiBarbadianBasqueBelgianBelizeanBermudanBhutaneseBlackfeetBolivianBrazilianBritishBritish West IndianBulgarianBurmeseCajunCambodianCanadianCape VerdeanCarpatho RusynCelticCentral AmericanCentral American IndianCherokeeCheyenneChickasawChileanChineseChippewaChoctawColombianColvilleComancheCosta RicanCreeCreekCroatianCrowCubanCypriotCzechCzechoslovakianDanishDelawareDominicanDutchDutch West IndianEastern EuropeanEcuadorianEgyptianEnglishEstonianEthiopianEuropeanFijianFilipinoFinnishFrenchFrench American IndianFrench CanadianGermanGerman RussianGhanaianGreekGuamanian/ChamorroGuatemalanGuyaneseHaitianHmongHonduranHopiHoumaHungarianIcelanderIndian (Asian)IndonesianInupiatIranianIraqiIrishIroquoisIsraeliItalianJamaicanJapaneseJordanianKenyanKiowaKoreanLaotianLatvianLebaneseLiberianLithuanianLumbeeLuxembourgerMacedonianMalaysianMalteseMarshalleseMenomineeMexicanMexican American IndianMongolianMoroccanNative HawaiianNavajoNepaleseNew ZealanderNicaraguanNigerianNorthern EuropeanNorwegianOkinawanOsageOttawaPaiutePakistaniPalestinianPanamanianParaguayanPennsylvania GermanPeruvianPimaPolishPortuguesePotawatomiPuebloPuerto RicanPuget Sound SalishRomanianRussianSalvadoranSamoanScandinavianScotch-IrishScottishSeminoleSenegaleseSerbianShoshoneSierra LeoneanSiouxSlavicSlovakSloveneSomaliSouth AfricanSouth AmericanSouth American IndianSoviet UnionSpaniardSpanishSpanish AmericanSpanish American IndianSri LankanSubsaharan AfricanSudaneseSwedishSwissSyrianTaiwaneseThaiTlingit-HaidaTohono O'OdhamTonganTrinidadian and TobagonianTsimshianTurkishU.S. Virgin IslanderUgandanUkrainianUruguayanUteVenezuelanVietnameseWelshWest IndianYakamaYaquiYugoslavianYumanYup'ikZimbabwean
Immigration
NonimmigrantsImmigrantsAfghanistanAfricaAlbaniaArgentinaArmeniaAsiaAustraliaAustriaBahamasBangladeshBarbadosBelarusBelizeBoliviaBosnia and HerzegovinaBrazilBulgariaBurma/MyanmarCabo VerdeCambodiaCameroonCanadaCaribbeanCentral AmericaChileChinaColombiaCongoCosta RicaCroatiaCubaCzechoslovakiaDenmarkDominicaDominican RepublicEastern AfricaEastern AsiaEastern EuropeEcuadorEgyptEl SalvadorEnglandEritreaEthiopiaEuropeFijiFranceGermanyGhanaGreeceGrenadaGuatemalaGuyanaHaitiHondurasHong KongHungaryIndiaIndonesiaIranIraqIrelandIsraelItalyJamaicaJapanJordanKazakhstanKenyaKoreaKuwaitLaosLatin AmericaLatviaLebanonLiberiaLithuaniaMalaysiaMexicoMicronesiaMiddle AfricaMoldovaMoroccoNepalNetherlandsNicaraguaNigeriaNorth AmericaNorth MacedoniaNorthern AfricaNorthern EuropeNorwayOceaniaPakistanPanamaPeruPhilippinesPolandPortugalRomaniaRussiaSaudi ArabiaScotlandSenegalSerbiaSierra LeoneSingaporeSomaliaSouth AfricaSouth AmericaSouth Central AsiaSouth Eastern AsiaSouthern EuropeSpainSri LankaSt. Vincent and the GrenadinesSudanSwedenSwitzerlandSyriaTaiwanThailandTrinidad and TobagoTurkeyUgandaUkraineUruguayUzbekistanVenezuelaVietnamWest IndiesWestern AfricaWestern AsiaWestern EuropeYemenZaireZimbabweAzores
Immigrants from Belgium
Race
Ancestry
AfghanAfricanAlaska NativeAlaskan AthabascanAlbanianAleutAlsatianAmericanApacheArabArapahoArgentineanArmenianAssyrian/Chaldean/SyriacAustralianAustrianBahamianBangladeshiBarbadianBasqueBelgianBelizeanBermudanBlackfeetBolivianBrazilianBritishBritish West IndianBulgarianBurmeseCajunCambodianCanadianCape VerdeanCarpatho RusynCelticCentral AmericanCentral American IndianCherokeeCheyenneChickasawChileanChineseChippewaChoctawColombianColvilleComancheCosta RicanCreeCreekCroatianCrowCubanCypriotCzechCzechoslovakianDanishDelawareDominicanDutchDutch West IndianEastern EuropeanEcuadorianEgyptianEnglishEstonianEthiopianEuropeanFijianFilipinoFinnishFrenchFrench American IndianFrench CanadianGermanGerman RussianGhanaianGreekGuamanian/ChamorroGuatemalanGuyaneseHaitianHmongHonduranHopiHoumaHungarianIcelanderIndian (Asian)IndonesianInupiatIranianIraqiIrishIroquoisIsraeliItalianJamaicanJapaneseJordanianKenyanKiowaKoreanLaotianLatvianLebaneseLiberianLithuanianLumbeeLuxembourgerMacedonianMalaysianMalteseMarshalleseMenomineeMexicanMexican American IndianMongolianMoroccanNative HawaiianNavajoNepaleseNew ZealanderNicaraguanNigerianNorthern EuropeanNorwegianOkinawanOsageOttawaPaiutePakistaniPalestinianPanamanianParaguayanPennsylvania GermanPeruvianPimaPolishPortuguesePotawatomiPuebloPuerto RicanPuget Sound SalishRomanianRussianSalvadoranSamoanScandinavianScotch-IrishScottishSeminoleSenegaleseSerbianShoshoneSierra LeoneanSiouxSlavicSlovakSloveneSomaliSouth AfricanSouth AmericanSouth American IndianSoviet UnionSpaniardSpanishSpanish AmericanSpanish American IndianSri LankanSubsaharan AfricanSudaneseSwedishSwissSyrianTaiwaneseThaiTlingit-HaidaTohono O'OdhamTonganTrinidadian and TobagonianTsimshianTurkishU.S. Virgin IslanderUgandanUkrainianUruguayanUteVenezuelanVietnameseWelshWest IndianYakamaYaquiYugoslavianYumanYup'ikZimbabwean
Immigration
NonimmigrantsImmigrantsAfghanistanAfricaAlbaniaArgentinaArmeniaAsiaAustraliaAustriaBahamasBangladeshBarbadosBelarusBelgiumBelizeBoliviaBosnia and HerzegovinaBrazilBulgariaBurma/MyanmarCabo VerdeCambodiaCameroonCanadaCaribbeanCentral AmericaChileChinaColombiaCongoCosta RicaCroatiaCubaCzechoslovakiaDenmarkDominicaDominican RepublicEastern AfricaEastern AsiaEastern EuropeEcuadorEgyptEl SalvadorEnglandEritreaEthiopiaEuropeFijiFranceGermanyGhanaGreeceGrenadaGuatemalaGuyanaHaitiHondurasHong KongHungaryIndiaIndonesiaIranIraqIrelandIsraelItalyJamaicaJapanJordanKazakhstanKenyaKoreaKuwaitLaosLatin AmericaLatviaLebanonLiberiaLithuaniaMalaysiaMexicoMicronesiaMiddle AfricaMoldovaMoroccoNepalNetherlandsNicaraguaNigeriaNorth AmericaNorth MacedoniaNorthern AfricaNorthern EuropeNorwayOceaniaPakistanPanamaPeruPhilippinesPolandPortugalRomaniaRussiaSaudi ArabiaScotlandSenegalSerbiaSierra LeoneSingaporeSomaliaSouth AfricaSouth AmericaSouth Central AsiaSouth Eastern AsiaSouthern EuropeSpainSri LankaSt. Vincent and the GrenadinesSudanSwedenSwitzerlandSyriaTaiwanThailandTrinidad and TobagoTurkeyUgandaUkraineUruguayUzbekistanVenezuelaVietnamWest IndiesWestern AfricaWestern AsiaWestern EuropeYemenZaireZimbabweAzores
Median Household Income
Income
Poverty
Unemployment
Labor Participation
Family Structure
Vehicle Availability
Education Level
Disability

Median Household Income Comparison

Bhutanese

Immigrants from Belgium

Exceptional
Exceptional
$100,151
MEDIAN HOUSEHOLD INCOME
100.0/ 100
METRIC RATING
27th/ 347
METRIC RANK
$100,306
MEDIAN HOUSEHOLD INCOME
100.0/ 100
METRIC RATING
26th/ 347
METRIC RANK

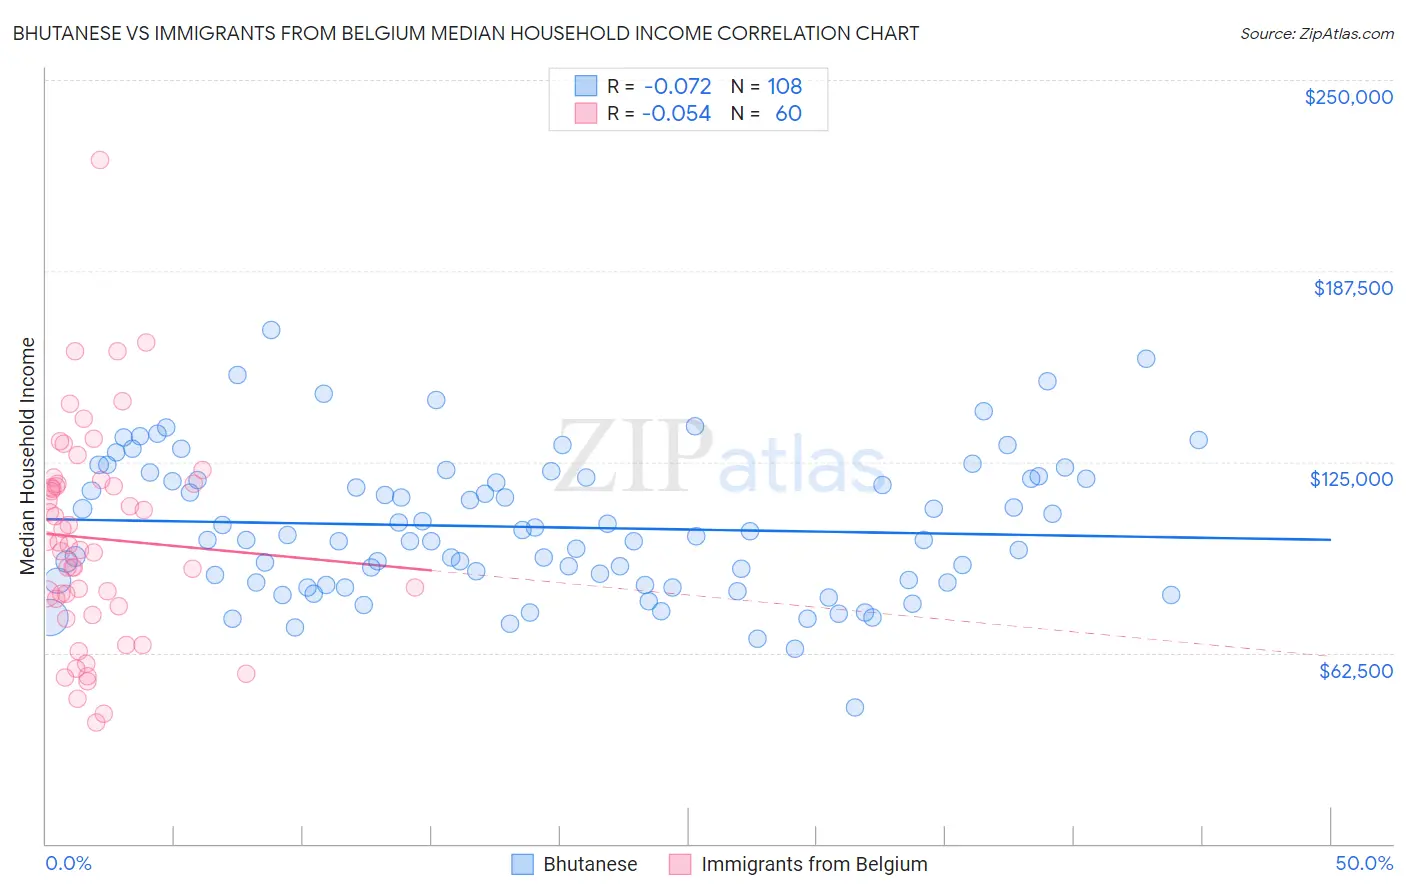
Bhutanese vs Immigrants from Belgium Median Household Income Correlation Chart

The statistical analysis conducted on geographies consisting of 455,036,820 people shows a slight negative correlation between the proportion of Bhutanese and median household income in the United States with a correlation coefficient (R) of -0.072 and weighted average of $100,151. Similarly, the statistical analysis conducted on geographies consisting of 146,650,493 people shows a slight negative correlation between the proportion of Immigrants from Belgium and median household income in the United States with a correlation coefficient (R) of -0.054 and weighted average of $100,306, a difference of 0.15%.
Bhutanese vs Immigrants from Belgium Median Household Income

Median Household Income Correlation Summary

MeasurementBhutaneseImmigrants from Belgium
Minimum$44,611$39,542
Maximum$168,247$223,750
Range$123,636$184,208
Mean$103,677$99,959
Median$100,131$98,272
Interquartile 25% (IQ1)$85,552$78,898
Interquartile 75% (IQ3)$119,777$117,778
Interquartile Range (IQR)$34,225$38,881
Standard Deviation (Sample)$23,044$34,343
Standard Deviation (Population)$22,937$34,056

Demographics Similar to Bhutanese and Immigrants from Belgium by Median Household Income

In terms of median household income, the demographic groups most similar to Bhutanese are Immigrants from Sri Lanka ($99,943, a difference of 0.21%), Immigrants from Asia ($99,933, a difference of 0.22%), Immigrants from Northern Europe ($99,813, a difference of 0.34%), Immigrants from Sweden ($100,699, a difference of 0.55%), and Immigrants from Japan ($100,711, a difference of 0.56%). Similarly, the demographic groups most similar to Immigrants from Belgium are Immigrants from Sri Lanka ($99,943, a difference of 0.36%), Immigrants from Asia ($99,933, a difference of 0.37%), Immigrants from Sweden ($100,699, a difference of 0.39%), Immigrants from Japan ($100,711, a difference of 0.40%), and Immigrants from Northern Europe ($99,813, a difference of 0.49%).
DemographicsRating | RankMedian Household Income
Burmese
100.0
/100
|
#16
Exceptional
$103,145
Immigrants | Korea
100.0
/100
|
#17
Exceptional
$102,962
Cypriots
100.0
/100
|
#18
Exceptional
$102,843
Immigrants | Australia
100.0
/100
|
#19
Exceptional
$102,562
Bolivians
100.0
/100
|
#20
Exceptional
$102,195
Eastern Europeans
100.0
/100
|
#21
Exceptional
$101,781
Asians
100.0
/100
|
#22
Exceptional
$101,681
Immigrants | Bolivia
100.0
/100
|
#23
Exceptional
$101,394
Immigrants | Japan
100.0
/100
|
#24
Exceptional
$100,711
Immigrants | Sweden
100.0
/100
|
#25
Exceptional
$100,699
Immigrants | Belgium
100.0
/100
|
#26
Exceptional
$100,306
Bhutanese
100.0
/100
|
#27
Exceptional
$100,151
Immigrants | Sri Lanka
100.0
/100
|
#28
Exceptional
$99,943
Immigrants | Asia
100.0
/100
|
#29
Exceptional
$99,933
Immigrants | Northern Europe
100.0
/100
|
#30
Exceptional
$99,813
Turks
100.0
/100
|
#31
Exceptional
$99,389
Immigrants | Denmark
100.0
/100
|
#32
Exceptional
$98,510
Chinese
100.0
/100
|
#33
Exceptional
$98,496
Russians
100.0
/100
|
#34
Exceptional
$98,008
Immigrants | Switzerland
100.0
/100
|
#35
Exceptional
$97,979
Immigrants | Pakistan
100.0
/100
|
#36
Exceptional
$97,528