Immigrants from Burma/Myanmar vs Immigrants from Belgium Median Household Income
COMPARE
Immigrants from Burma/Myanmar
Immigrants from Belgium
Median Household Income
Median Household Income Comparison
Immigrants from Burma/Myanmar
Immigrants from Belgium
$78,682
MEDIAN HOUSEHOLD INCOME
1.6/ 100
METRIC RATING
247th/ 347
METRIC RANK
$100,306
MEDIAN HOUSEHOLD INCOME
100.0/ 100
METRIC RATING
26th/ 347
METRIC RANK
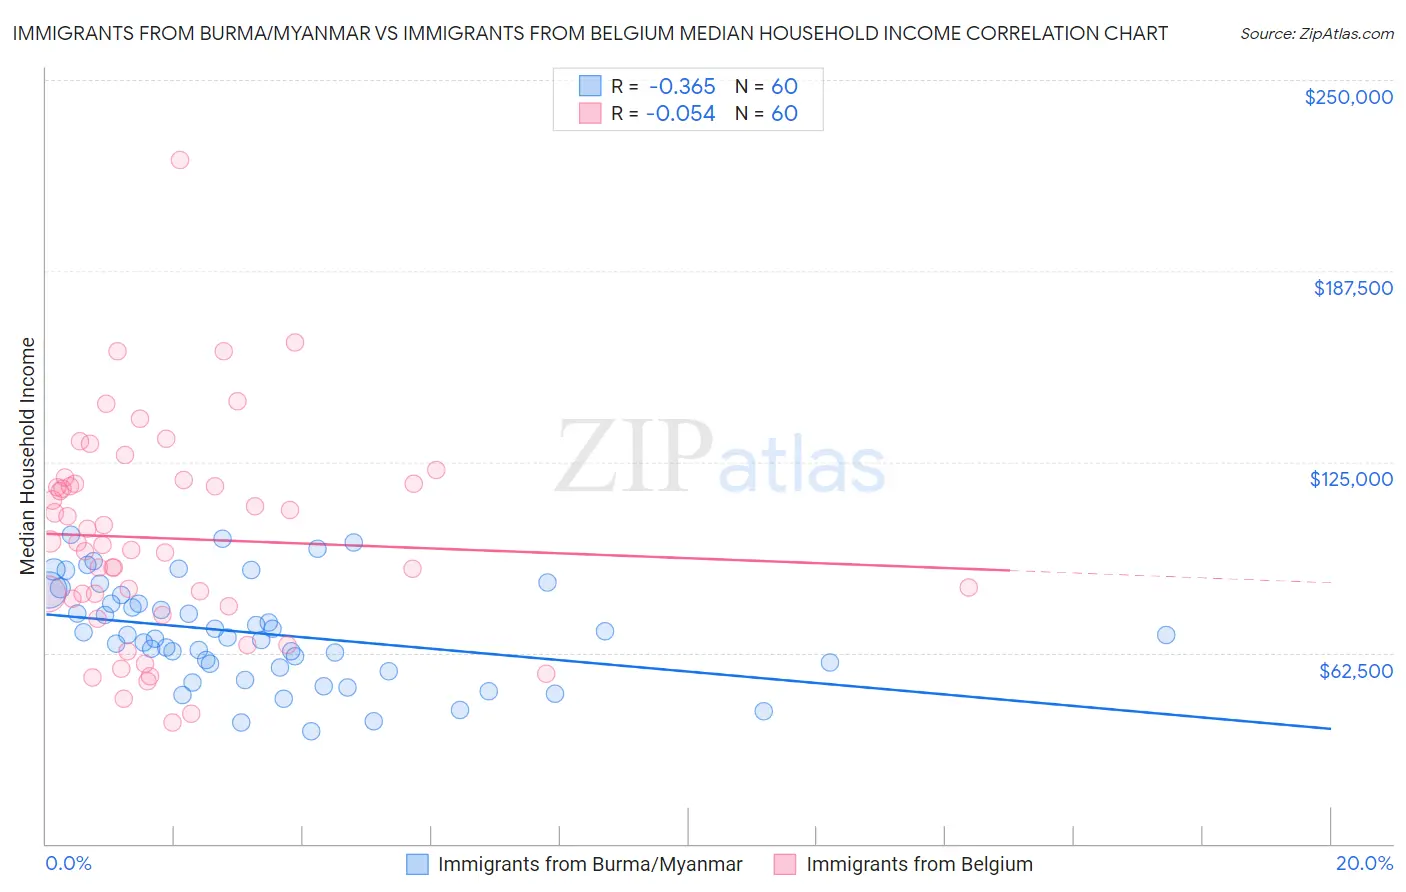
Immigrants from Burma/Myanmar vs Immigrants from Belgium Median Household Income Correlation Chart
The statistical analysis conducted on geographies consisting of 172,235,466 people shows a mild negative correlation between the proportion of Immigrants from Burma/Myanmar and median household income in the United States with a correlation coefficient (R) of -0.365 and weighted average of $78,682. Similarly, the statistical analysis conducted on geographies consisting of 146,650,493 people shows a slight negative correlation between the proportion of Immigrants from Belgium and median household income in the United States with a correlation coefficient (R) of -0.054 and weighted average of $100,306, a difference of 27.5%.
Median Household Income Correlation Summary
| Measurement | Immigrants from Burma/Myanmar | Immigrants from Belgium |
| Minimum | $36,966 | $39,542 |
| Maximum | $101,230 | $223,750 |
| Range | $64,264 | $184,208 |
| Mean | $68,823 | $99,959 |
| Median | $67,779 | $98,272 |
| Interquartile 25% (IQ1) | $58,487 | $78,898 |
| Interquartile 75% (IQ3) | $79,866 | $117,778 |
| Interquartile Range (IQR) | $21,379 | $38,881 |
| Standard Deviation (Sample) | $16,228 | $34,343 |
| Standard Deviation (Population) | $16,092 | $34,056 |
Similar Demographics by Median Household Income
Demographics Similar to Immigrants from Burma/Myanmar by Median Household Income
In terms of median household income, the demographic groups most similar to Immigrants from Burma/Myanmar are Central American ($78,803, a difference of 0.15%), Sudanese ($78,529, a difference of 0.19%), Inupiat ($78,841, a difference of 0.20%), West Indian ($78,455, a difference of 0.29%), and Marshallese ($78,930, a difference of 0.32%).
| Demographics | Rating | Rank | Median Household Income |
| Immigrants | Western Africa | 2.7 /100 | #240 | Tragic $79,490 |
| Immigrants | Nonimmigrants | 2.6 /100 | #241 | Tragic $79,429 |
| Immigrants | Sudan | 2.1 /100 | #242 | Tragic $79,103 |
| Immigrants | Barbados | 1.9 /100 | #243 | Tragic $78,989 |
| Marshallese | 1.9 /100 | #244 | Tragic $78,930 |
| Inupiat | 1.8 /100 | #245 | Tragic $78,841 |
| Central Americans | 1.7 /100 | #246 | Tragic $78,803 |
| Immigrants | Burma/Myanmar | 1.6 /100 | #247 | Tragic $78,682 |
| Sudanese | 1.5 /100 | #248 | Tragic $78,529 |
| West Indians | 1.4 /100 | #249 | Tragic $78,455 |
| Immigrants | Laos | 1.3 /100 | #250 | Tragic $78,327 |
| Mexican American Indians | 1.2 /100 | #251 | Tragic $78,166 |
| Immigrants | West Indies | 1.0 /100 | #252 | Tragic $77,956 |
| Immigrants | St. Vincent and the Grenadines | 0.9 /100 | #253 | Tragic $77,690 |
| Sub-Saharan Africans | 0.8 /100 | #254 | Tragic $77,631 |
Demographics Similar to Immigrants from Belgium by Median Household Income
In terms of median household income, the demographic groups most similar to Immigrants from Belgium are Bhutanese ($100,151, a difference of 0.15%), Immigrants from Sri Lanka ($99,943, a difference of 0.36%), Immigrants from Asia ($99,933, a difference of 0.37%), Immigrants from Sweden ($100,699, a difference of 0.39%), and Immigrants from Japan ($100,711, a difference of 0.40%).
| Demographics | Rating | Rank | Median Household Income |
| Immigrants | Australia | 100.0 /100 | #19 | Exceptional $102,562 |
| Bolivians | 100.0 /100 | #20 | Exceptional $102,195 |
| Eastern Europeans | 100.0 /100 | #21 | Exceptional $101,781 |
| Asians | 100.0 /100 | #22 | Exceptional $101,681 |
| Immigrants | Bolivia | 100.0 /100 | #23 | Exceptional $101,394 |
| Immigrants | Japan | 100.0 /100 | #24 | Exceptional $100,711 |
| Immigrants | Sweden | 100.0 /100 | #25 | Exceptional $100,699 |
| Immigrants | Belgium | 100.0 /100 | #26 | Exceptional $100,306 |
| Bhutanese | 100.0 /100 | #27 | Exceptional $100,151 |
| Immigrants | Sri Lanka | 100.0 /100 | #28 | Exceptional $99,943 |
| Immigrants | Asia | 100.0 /100 | #29 | Exceptional $99,933 |
| Immigrants | Northern Europe | 100.0 /100 | #30 | Exceptional $99,813 |
| Turks | 100.0 /100 | #31 | Exceptional $99,389 |
| Immigrants | Denmark | 100.0 /100 | #32 | Exceptional $98,510 |
| Chinese | 100.0 /100 | #33 | Exceptional $98,496 |