Serbian vs Immigrants from Latvia Median Family Income
COMPARE
Serbian
Immigrants from Latvia
Median Family Income
Median Family Income Comparison
Serbians
Immigrants from Latvia
$107,157
MEDIAN FAMILY INCOME
90.8/ 100
METRIC RATING
126th/ 347
METRIC RANK
$114,826
MEDIAN FAMILY INCOME
99.8/ 100
METRIC RATING
60th/ 347
METRIC RANK
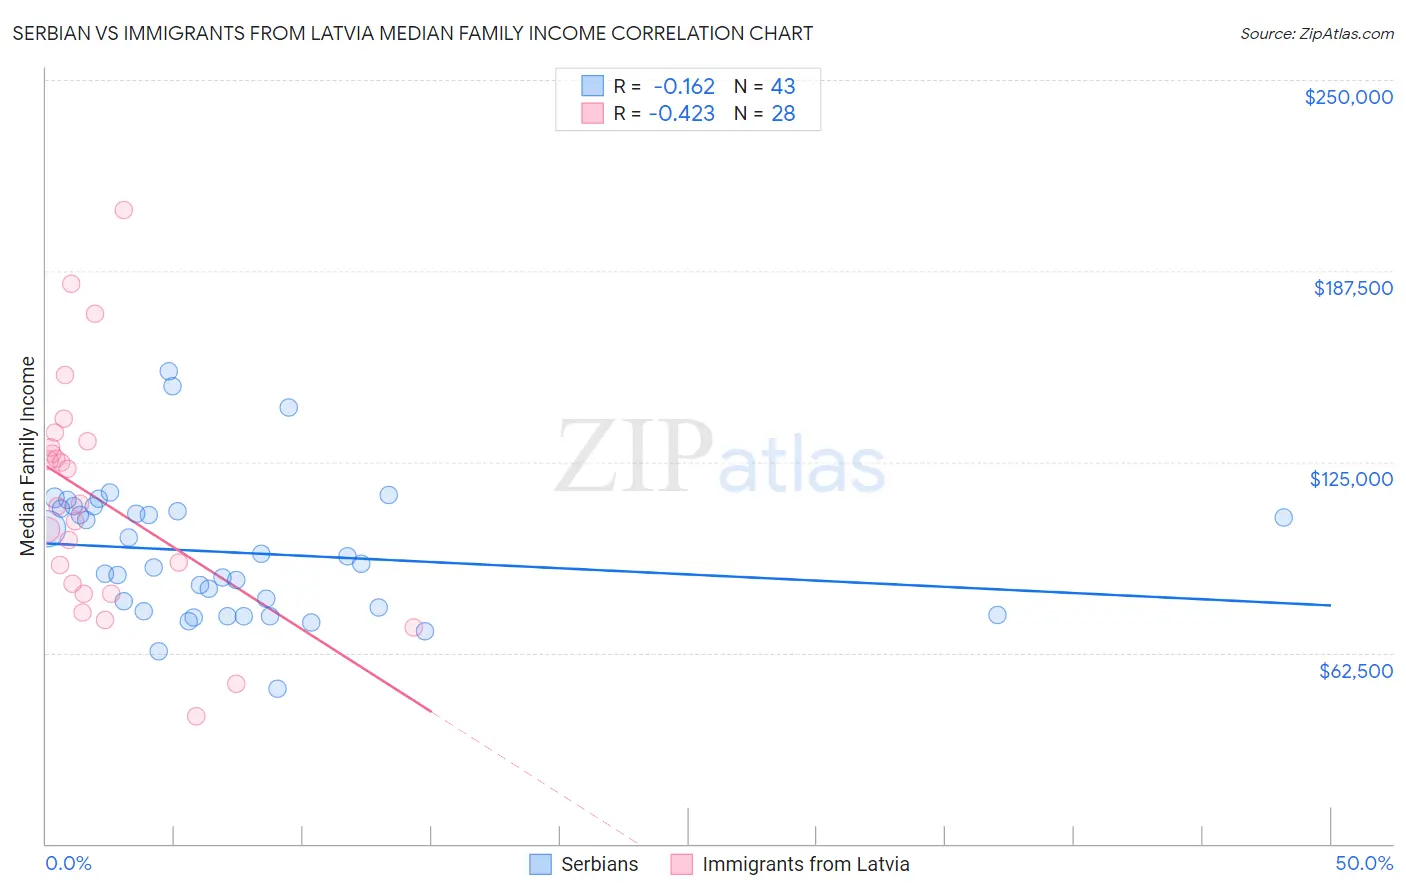
Serbian vs Immigrants from Latvia Median Family Income Correlation Chart
The statistical analysis conducted on geographies consisting of 267,482,647 people shows a poor negative correlation between the proportion of Serbians and median family income in the United States with a correlation coefficient (R) of -0.162 and weighted average of $107,157. Similarly, the statistical analysis conducted on geographies consisting of 113,722,830 people shows a moderate negative correlation between the proportion of Immigrants from Latvia and median family income in the United States with a correlation coefficient (R) of -0.423 and weighted average of $114,826, a difference of 7.2%.
Median Family Income Correlation Summary
| Measurement | Serbian | Immigrants from Latvia |
| Minimum | $50,679 | $41,641 |
| Maximum | $154,464 | $207,328 |
| Range | $103,785 | $165,687 |
| Mean | $95,313 | $112,663 |
| Median | $91,648 | $110,782 |
| Interquartile 25% (IQ1) | $76,245 | $83,546 |
| Interquartile 75% (IQ3) | $109,780 | $130,754 |
| Interquartile Range (IQR) | $33,535 | $47,207 |
| Standard Deviation (Sample) | $22,166 | $38,081 |
| Standard Deviation (Population) | $21,907 | $37,395 |
Similar Demographics by Median Family Income
Demographics Similar to Serbians by Median Family Income
In terms of median family income, the demographic groups most similar to Serbians are Lebanese ($107,086, a difference of 0.070%), Taiwanese ($107,295, a difference of 0.13%), Immigrants from Ethiopia ($106,969, a difference of 0.18%), Arab ($106,952, a difference of 0.19%), and Brazilian ($106,942, a difference of 0.20%).
| Demographics | Rating | Rank | Median Family Income |
| Sri Lankans | 94.5 /100 | #119 | Exceptional $108,234 |
| Immigrants | Northern Africa | 94.3 /100 | #120 | Exceptional $108,161 |
| Europeans | 94.1 /100 | #121 | Exceptional $108,099 |
| Immigrants | Jordan | 92.9 /100 | #122 | Exceptional $107,715 |
| Carpatho Rusyns | 92.2 /100 | #123 | Exceptional $107,502 |
| Pakistanis | 91.7 /100 | #124 | Exceptional $107,390 |
| Taiwanese | 91.4 /100 | #125 | Exceptional $107,295 |
| Serbians | 90.8 /100 | #126 | Exceptional $107,157 |
| Lebanese | 90.5 /100 | #127 | Exceptional $107,086 |
| Immigrants | Ethiopia | 90.0 /100 | #128 | Excellent $106,969 |
| Arabs | 89.9 /100 | #129 | Excellent $106,952 |
| Brazilians | 89.8 /100 | #130 | Excellent $106,942 |
| Canadians | 88.1 /100 | #131 | Excellent $106,597 |
| Immigrants | Fiji | 87.8 /100 | #132 | Excellent $106,544 |
| Ugandans | 87.8 /100 | #133 | Excellent $106,541 |
Demographics Similar to Immigrants from Latvia by Median Family Income
In terms of median family income, the demographic groups most similar to Immigrants from Latvia are Immigrants from Netherlands ($114,987, a difference of 0.14%), Immigrants from Belarus ($114,586, a difference of 0.21%), Mongolian ($114,553, a difference of 0.24%), Immigrants from Indonesia ($115,162, a difference of 0.29%), and Greek ($115,192, a difference of 0.32%).
| Demographics | Rating | Rank | Median Family Income |
| Immigrants | Norway | 99.9 /100 | #53 | Exceptional $115,847 |
| Immigrants | Europe | 99.9 /100 | #54 | Exceptional $115,523 |
| Lithuanians | 99.8 /100 | #55 | Exceptional $115,395 |
| New Zealanders | 99.8 /100 | #56 | Exceptional $115,230 |
| Greeks | 99.8 /100 | #57 | Exceptional $115,192 |
| Immigrants | Indonesia | 99.8 /100 | #58 | Exceptional $115,162 |
| Immigrants | Netherlands | 99.8 /100 | #59 | Exceptional $114,987 |
| Immigrants | Latvia | 99.8 /100 | #60 | Exceptional $114,826 |
| Immigrants | Belarus | 99.8 /100 | #61 | Exceptional $114,586 |
| Mongolians | 99.8 /100 | #62 | Exceptional $114,553 |
| Immigrants | Pakistan | 99.8 /100 | #63 | Exceptional $114,406 |
| Immigrants | Scotland | 99.7 /100 | #64 | Exceptional $114,392 |
| Egyptians | 99.7 /100 | #65 | Exceptional $114,119 |
| Paraguayans | 99.7 /100 | #66 | Exceptional $114,016 |
| Immigrants | Spain | 99.7 /100 | #67 | Exceptional $113,815 |