Bulgarian vs Immigrants from Dominican Republic Median Earnings
COMPARE
Bulgarian
Immigrants from Dominican Republic
Median Earnings
Median Earnings Comparison
Bulgarians
Immigrants from Dominican Republic
$52,512
MEDIAN EARNINGS
100.0/ 100
METRIC RATING
44th/ 347
METRIC RANK
$41,554
MEDIAN EARNINGS
0.1/ 100
METRIC RATING
288th/ 347
METRIC RANK
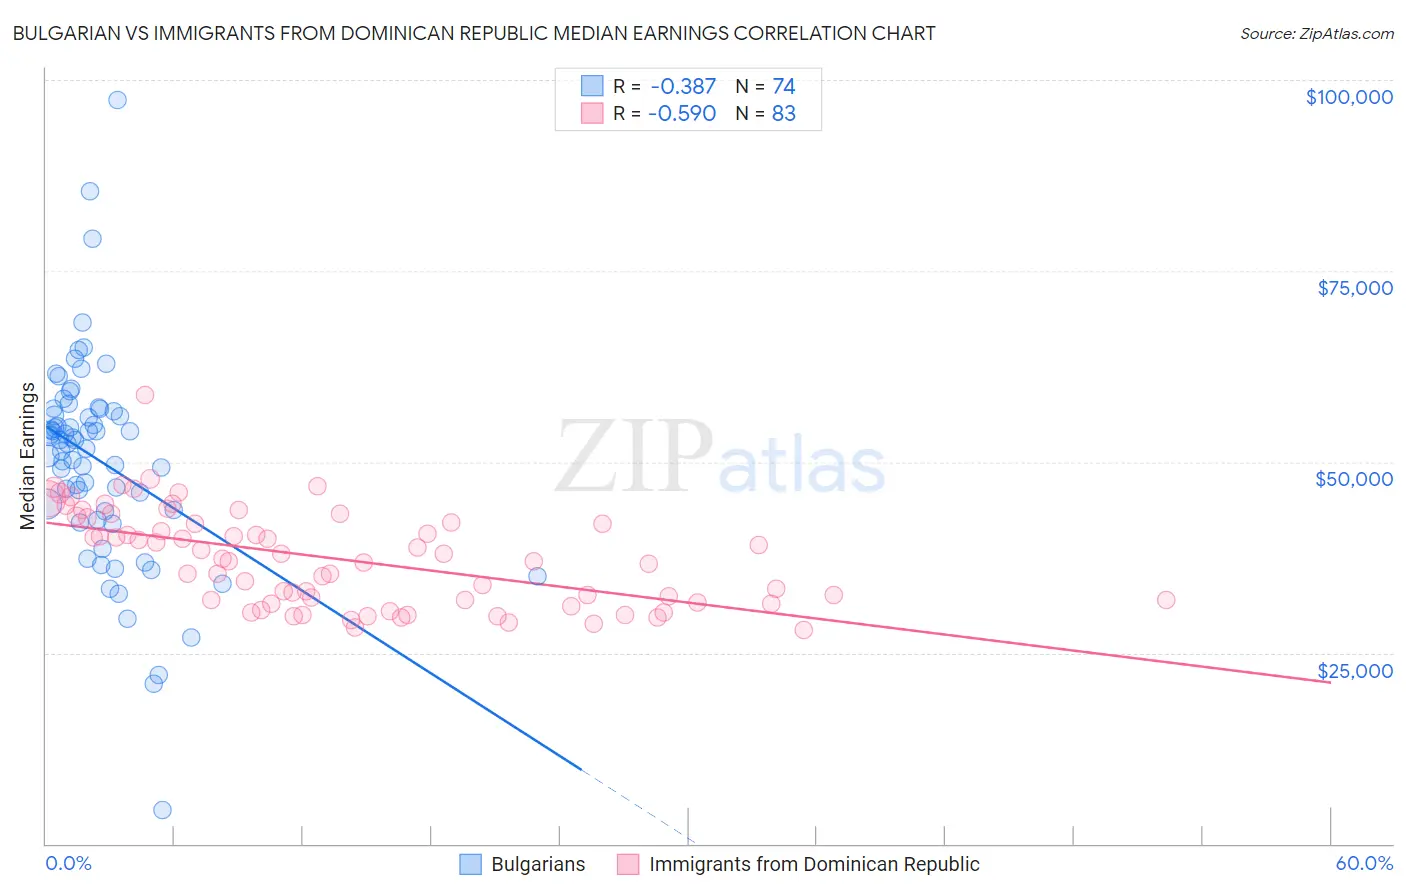
Bulgarian vs Immigrants from Dominican Republic Median Earnings Correlation Chart
The statistical analysis conducted on geographies consisting of 205,611,933 people shows a mild negative correlation between the proportion of Bulgarians and median earnings in the United States with a correlation coefficient (R) of -0.387 and weighted average of $52,512. Similarly, the statistical analysis conducted on geographies consisting of 275,134,235 people shows a substantial negative correlation between the proportion of Immigrants from Dominican Republic and median earnings in the United States with a correlation coefficient (R) of -0.590 and weighted average of $41,554, a difference of 26.4%.
Median Earnings Correlation Summary
| Measurement | Bulgarian | Immigrants from Dominican Republic |
| Minimum | $4,447 | $28,009 |
| Maximum | $97,313 | $58,780 |
| Range | $92,866 | $30,771 |
| Mean | $50,155 | $37,276 |
| Median | $52,637 | $37,042 |
| Interquartile 25% (IQ1) | $43,589 | $31,535 |
| Interquartile 75% (IQ3) | $56,548 | $42,082 |
| Interquartile Range (IQR) | $12,959 | $10,547 |
| Standard Deviation (Sample) | $13,758 | $6,269 |
| Standard Deviation (Population) | $13,665 | $6,231 |
Similar Demographics by Median Earnings
Demographics Similar to Bulgarians by Median Earnings
In terms of median earnings, the demographic groups most similar to Bulgarians are Immigrants from Malaysia ($52,514, a difference of 0.0%), Maltese ($52,526, a difference of 0.030%), Immigrants from Czechoslovakia ($52,361, a difference of 0.29%), Bhutanese ($52,297, a difference of 0.41%), and Australian ($52,294, a difference of 0.42%).
| Demographics | Rating | Rank | Median Earnings |
| Immigrants | Belarus | 100.0 /100 | #37 | Exceptional $53,043 |
| Latvians | 100.0 /100 | #38 | Exceptional $53,001 |
| Immigrants | Turkey | 100.0 /100 | #39 | Exceptional $52,960 |
| Israelis | 100.0 /100 | #40 | Exceptional $52,937 |
| Immigrants | Lithuania | 100.0 /100 | #41 | Exceptional $52,769 |
| Maltese | 100.0 /100 | #42 | Exceptional $52,526 |
| Immigrants | Malaysia | 100.0 /100 | #43 | Exceptional $52,514 |
| Bulgarians | 100.0 /100 | #44 | Exceptional $52,512 |
| Immigrants | Czechoslovakia | 100.0 /100 | #45 | Exceptional $52,361 |
| Bhutanese | 100.0 /100 | #46 | Exceptional $52,297 |
| Australians | 100.0 /100 | #47 | Exceptional $52,294 |
| Immigrants | Europe | 100.0 /100 | #48 | Exceptional $52,195 |
| Bolivians | 100.0 /100 | #49 | Exceptional $52,005 |
| Immigrants | South Africa | 100.0 /100 | #50 | Exceptional $51,850 |
| Immigrants | Austria | 99.9 /100 | #51 | Exceptional $51,826 |
Demographics Similar to Immigrants from Dominican Republic by Median Earnings
In terms of median earnings, the demographic groups most similar to Immigrants from Dominican Republic are Comanche ($41,519, a difference of 0.080%), Paiute ($41,508, a difference of 0.11%), Central American Indian ($41,474, a difference of 0.19%), U.S. Virgin Islander ($41,448, a difference of 0.26%), and Indonesian ($41,701, a difference of 0.35%).
| Demographics | Rating | Rank | Median Earnings |
| Marshallese | 0.2 /100 | #281 | Tragic $41,969 |
| Africans | 0.2 /100 | #282 | Tragic $41,955 |
| Dominicans | 0.2 /100 | #283 | Tragic $41,864 |
| Blackfeet | 0.2 /100 | #284 | Tragic $41,822 |
| Immigrants | Nicaragua | 0.1 /100 | #285 | Tragic $41,737 |
| Mexican American Indians | 0.1 /100 | #286 | Tragic $41,719 |
| Indonesians | 0.1 /100 | #287 | Tragic $41,701 |
| Immigrants | Dominican Republic | 0.1 /100 | #288 | Tragic $41,554 |
| Comanche | 0.1 /100 | #289 | Tragic $41,519 |
| Paiute | 0.1 /100 | #290 | Tragic $41,508 |
| Central American Indians | 0.1 /100 | #291 | Tragic $41,474 |
| U.S. Virgin Islanders | 0.1 /100 | #292 | Tragic $41,448 |
| Immigrants | Zaire | 0.1 /100 | #293 | Tragic $41,325 |
| Potawatomi | 0.1 /100 | #294 | Tragic $41,288 |
| Bangladeshis | 0.1 /100 | #295 | Tragic $41,263 |