Immigrants from Eastern Europe vs Immigrants from Dominican Republic Median Earnings
COMPARE
Immigrants from Eastern Europe
Immigrants from Dominican Republic
Median Earnings
Median Earnings Comparison
Immigrants from Eastern Europe
Immigrants from Dominican Republic
$51,624
MEDIAN EARNINGS
99.9/ 100
METRIC RATING
57th/ 347
METRIC RANK
$41,554
MEDIAN EARNINGS
0.1/ 100
METRIC RATING
288th/ 347
METRIC RANK
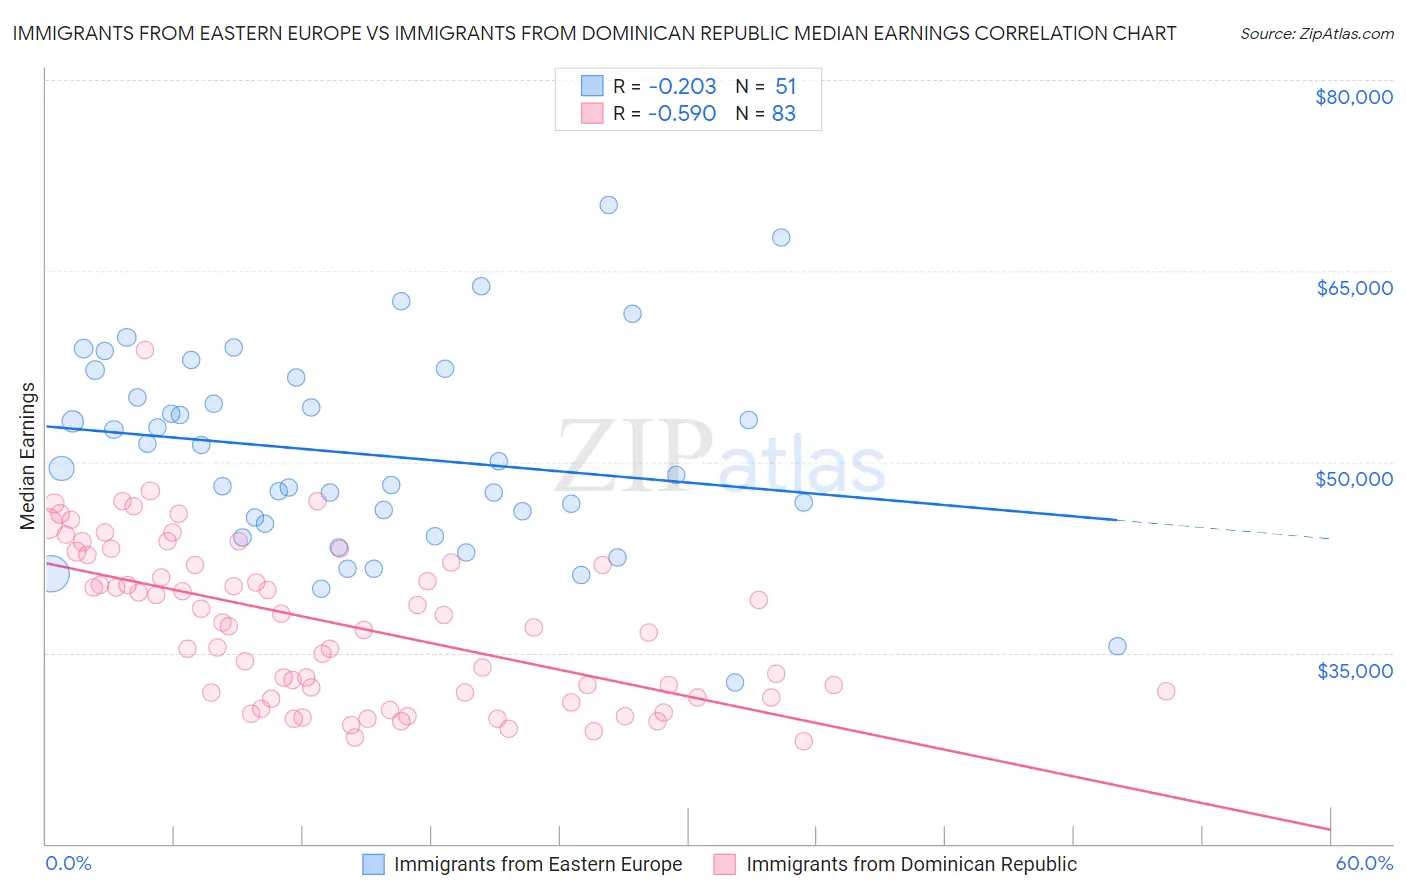
Immigrants from Eastern Europe vs Immigrants from Dominican Republic Median Earnings Correlation Chart
The statistical analysis conducted on geographies consisting of 475,833,062 people shows a weak negative correlation between the proportion of Immigrants from Eastern Europe and median earnings in the United States with a correlation coefficient (R) of -0.203 and weighted average of $51,624. Similarly, the statistical analysis conducted on geographies consisting of 275,134,235 people shows a substantial negative correlation between the proportion of Immigrants from Dominican Republic and median earnings in the United States with a correlation coefficient (R) of -0.590 and weighted average of $41,554, a difference of 24.2%.
Median Earnings Correlation Summary
| Measurement | Immigrants from Eastern Europe | Immigrants from Dominican Republic |
| Minimum | $32,703 | $28,009 |
| Maximum | $70,148 | $58,780 |
| Range | $37,445 | $30,771 |
| Mean | $50,592 | $37,276 |
| Median | $49,479 | $37,042 |
| Interquartile 25% (IQ1) | $45,140 | $31,535 |
| Interquartile 75% (IQ3) | $56,614 | $42,082 |
| Interquartile Range (IQR) | $11,474 | $10,547 |
| Standard Deviation (Sample) | $7,882 | $6,269 |
| Standard Deviation (Population) | $7,805 | $6,231 |
Similar Demographics by Median Earnings
Demographics Similar to Immigrants from Eastern Europe by Median Earnings
In terms of median earnings, the demographic groups most similar to Immigrants from Eastern Europe are Immigrants from Bolivia ($51,605, a difference of 0.040%), Immigrants from Croatia ($51,581, a difference of 0.080%), Immigrants from Pakistan ($51,693, a difference of 0.13%), Immigrants from Serbia ($51,557, a difference of 0.13%), and Immigrants from Latvia ($51,555, a difference of 0.13%).
| Demographics | Rating | Rank | Median Earnings |
| Immigrants | South Africa | 100.0 /100 | #50 | Exceptional $51,850 |
| Immigrants | Austria | 99.9 /100 | #51 | Exceptional $51,826 |
| Estonians | 99.9 /100 | #52 | Exceptional $51,772 |
| Immigrants | Norway | 99.9 /100 | #53 | Exceptional $51,758 |
| Immigrants | Indonesia | 99.9 /100 | #54 | Exceptional $51,715 |
| Egyptians | 99.9 /100 | #55 | Exceptional $51,701 |
| Immigrants | Pakistan | 99.9 /100 | #56 | Exceptional $51,693 |
| Immigrants | Eastern Europe | 99.9 /100 | #57 | Exceptional $51,624 |
| Immigrants | Bolivia | 99.9 /100 | #58 | Exceptional $51,605 |
| Immigrants | Croatia | 99.9 /100 | #59 | Exceptional $51,581 |
| Immigrants | Serbia | 99.9 /100 | #60 | Exceptional $51,557 |
| Immigrants | Latvia | 99.9 /100 | #61 | Exceptional $51,555 |
| Immigrants | Romania | 99.9 /100 | #62 | Exceptional $51,337 |
| Immigrants | Bulgaria | 99.9 /100 | #63 | Exceptional $51,318 |
| New Zealanders | 99.9 /100 | #64 | Exceptional $51,246 |
Demographics Similar to Immigrants from Dominican Republic by Median Earnings
In terms of median earnings, the demographic groups most similar to Immigrants from Dominican Republic are Comanche ($41,519, a difference of 0.080%), Paiute ($41,508, a difference of 0.11%), Central American Indian ($41,474, a difference of 0.19%), U.S. Virgin Islander ($41,448, a difference of 0.26%), and Indonesian ($41,701, a difference of 0.35%).
| Demographics | Rating | Rank | Median Earnings |
| Marshallese | 0.2 /100 | #281 | Tragic $41,969 |
| Africans | 0.2 /100 | #282 | Tragic $41,955 |
| Dominicans | 0.2 /100 | #283 | Tragic $41,864 |
| Blackfeet | 0.2 /100 | #284 | Tragic $41,822 |
| Immigrants | Nicaragua | 0.1 /100 | #285 | Tragic $41,737 |
| Mexican American Indians | 0.1 /100 | #286 | Tragic $41,719 |
| Indonesians | 0.1 /100 | #287 | Tragic $41,701 |
| Immigrants | Dominican Republic | 0.1 /100 | #288 | Tragic $41,554 |
| Comanche | 0.1 /100 | #289 | Tragic $41,519 |
| Paiute | 0.1 /100 | #290 | Tragic $41,508 |
| Central American Indians | 0.1 /100 | #291 | Tragic $41,474 |
| U.S. Virgin Islanders | 0.1 /100 | #292 | Tragic $41,448 |
| Immigrants | Zaire | 0.1 /100 | #293 | Tragic $41,325 |
| Potawatomi | 0.1 /100 | #294 | Tragic $41,288 |
| Bangladeshis | 0.1 /100 | #295 | Tragic $41,263 |