Dutch West Indian vs Finnish Median Male Earnings
COMPARE
Dutch West Indian
Finnish
Median Male Earnings
Median Male Earnings Comparison
Dutch West Indians
Finns
$46,656
MEDIAN MALE EARNINGS
0.0/ 100
METRIC RATING
306th/ 347
METRIC RANK
$54,721
MEDIAN MALE EARNINGS
55.6/ 100
METRIC RATING
170th/ 347
METRIC RANK
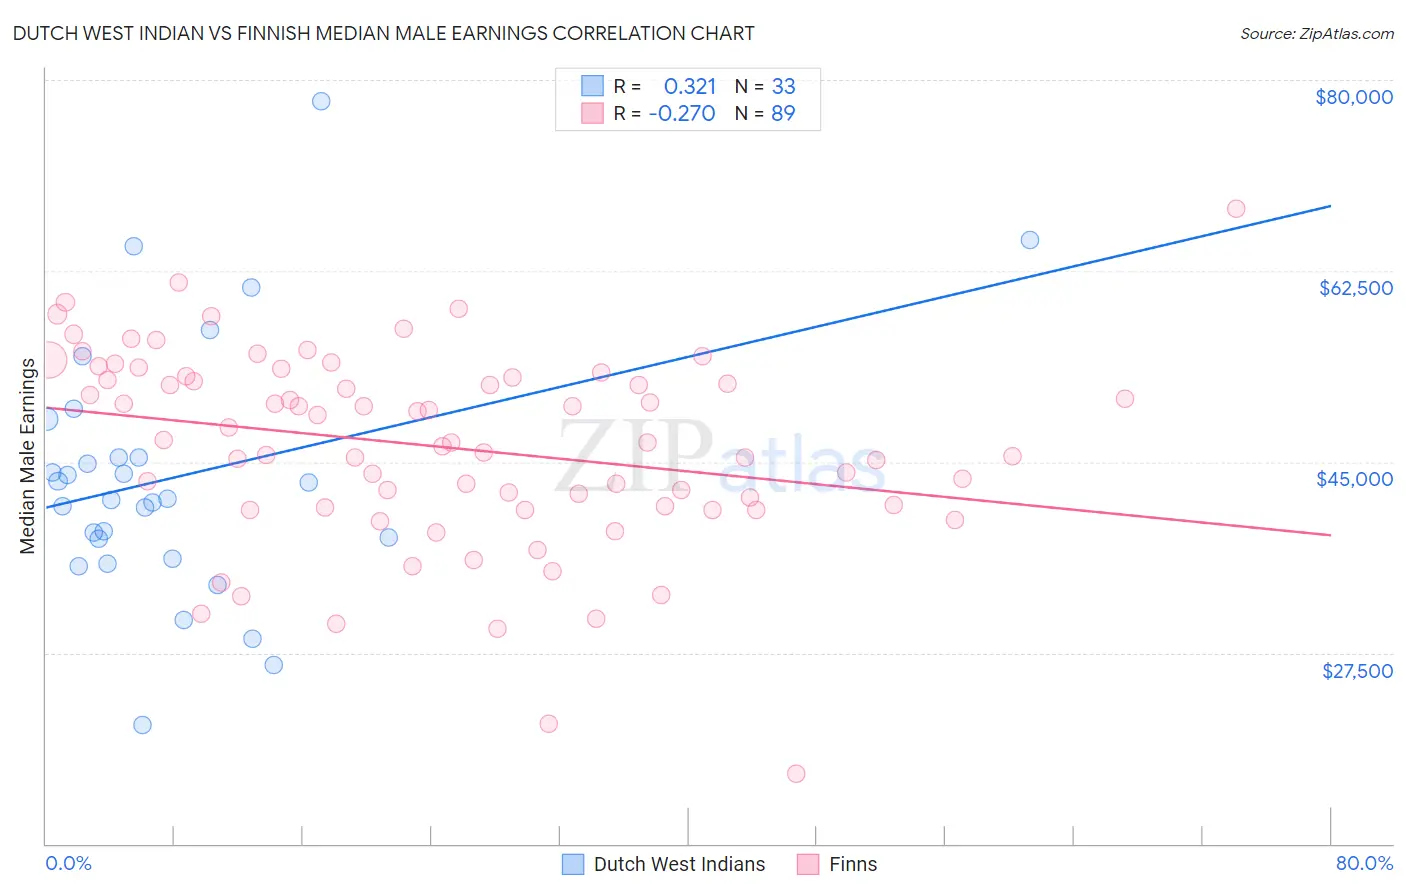
Dutch West Indian vs Finnish Median Male Earnings Correlation Chart
The statistical analysis conducted on geographies consisting of 85,752,443 people shows a mild positive correlation between the proportion of Dutch West Indians and median male earnings in the United States with a correlation coefficient (R) of 0.321 and weighted average of $46,656. Similarly, the statistical analysis conducted on geographies consisting of 404,473,332 people shows a weak negative correlation between the proportion of Finns and median male earnings in the United States with a correlation coefficient (R) of -0.270 and weighted average of $54,721, a difference of 17.3%.
Median Male Earnings Correlation Summary
| Measurement | Dutch West Indian | Finnish |
| Minimum | $20,833 | $16,413 |
| Maximum | $78,036 | $68,250 |
| Range | $57,203 | $51,837 |
| Mean | $43,636 | $46,398 |
| Median | $41,596 | $46,792 |
| Interquartile 25% (IQ1) | $37,034 | $40,892 |
| Interquartile 75% (IQ3) | $47,172 | $52,786 |
| Interquartile Range (IQR) | $10,138 | $11,894 |
| Standard Deviation (Sample) | $11,759 | $8,951 |
| Standard Deviation (Population) | $11,579 | $8,900 |
Similar Demographics by Median Male Earnings
Demographics Similar to Dutch West Indians by Median Male Earnings
In terms of median male earnings, the demographic groups most similar to Dutch West Indians are Immigrants from Dominican Republic ($46,655, a difference of 0.0%), Ottawa ($46,611, a difference of 0.10%), Creek ($46,594, a difference of 0.13%), Cuban ($46,580, a difference of 0.16%), and Guatemalan ($46,736, a difference of 0.17%).
| Demographics | Rating | Rank | Median Male Earnings |
| Immigrants | Zaire | 0.1 /100 | #299 | Tragic $47,070 |
| U.S. Virgin Islanders | 0.1 /100 | #300 | Tragic $47,066 |
| Immigrants | Latin America | 0.1 /100 | #301 | Tragic $46,941 |
| Seminole | 0.1 /100 | #302 | Tragic $46,783 |
| Yaqui | 0.1 /100 | #303 | Tragic $46,777 |
| Bangladeshis | 0.1 /100 | #304 | Tragic $46,744 |
| Guatemalans | 0.0 /100 | #305 | Tragic $46,736 |
| Dutch West Indians | 0.0 /100 | #306 | Tragic $46,656 |
| Immigrants | Dominican Republic | 0.0 /100 | #307 | Tragic $46,655 |
| Ottawa | 0.0 /100 | #308 | Tragic $46,611 |
| Creek | 0.0 /100 | #309 | Tragic $46,594 |
| Cubans | 0.0 /100 | #310 | Tragic $46,580 |
| Apache | 0.0 /100 | #311 | Tragic $46,429 |
| Hispanics or Latinos | 0.0 /100 | #312 | Tragic $46,419 |
| Hondurans | 0.0 /100 | #313 | Tragic $46,374 |
Demographics Similar to Finns by Median Male Earnings
In terms of median male earnings, the demographic groups most similar to Finns are French Canadian ($54,722, a difference of 0.0%), Immigrants from Peru ($54,695, a difference of 0.050%), Welsh ($54,647, a difference of 0.14%), Immigrants from Vietnam ($54,913, a difference of 0.35%), and South American Indian ($54,508, a difference of 0.39%).
| Demographics | Rating | Rank | Median Male Earnings |
| Ugandans | 68.6 /100 | #163 | Good $55,290 |
| Immigrants | South Eastern Asia | 67.6 /100 | #164 | Good $55,241 |
| Immigrants | Portugal | 66.3 /100 | #165 | Good $55,182 |
| Germans | 61.6 /100 | #166 | Good $54,974 |
| Immigrants | Fiji | 61.2 /100 | #167 | Good $54,958 |
| Immigrants | Vietnam | 60.2 /100 | #168 | Good $54,913 |
| French Canadians | 55.6 /100 | #169 | Average $54,722 |
| Finns | 55.6 /100 | #170 | Average $54,721 |
| Immigrants | Peru | 54.9 /100 | #171 | Average $54,695 |
| Welsh | 53.8 /100 | #172 | Average $54,647 |
| South American Indians | 50.4 /100 | #173 | Average $54,508 |
| South Americans | 50.0 /100 | #174 | Average $54,492 |
| Dutch | 48.0 /100 | #175 | Average $54,410 |
| Spaniards | 47.8 /100 | #176 | Average $54,401 |
| Costa Ricans | 44.8 /100 | #177 | Average $54,279 |