Hawaiian vs Pakistani Per Capita Income
COMPARE
Hawaiian
Pakistani
Per Capita Income
Per Capita Income Comparison
Hawaiians
Pakistanis
$39,403
PER CAPITA INCOME
0.8/ 100
METRIC RATING
256th/ 347
METRIC RANK
$45,587
PER CAPITA INCOME
89.7/ 100
METRIC RATING
133rd/ 347
METRIC RANK
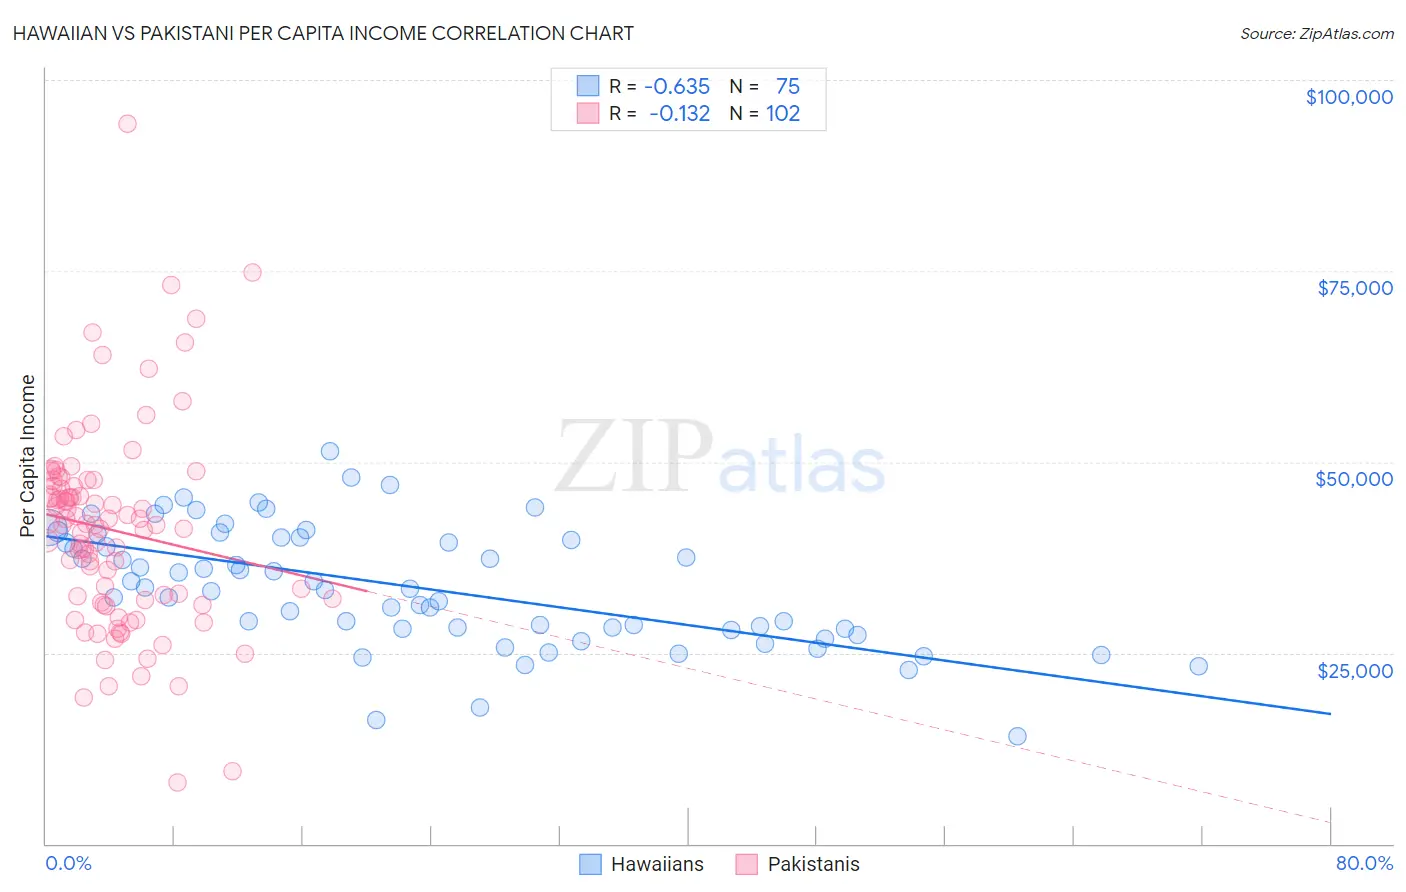
Hawaiian vs Pakistani Per Capita Income Correlation Chart
The statistical analysis conducted on geographies consisting of 327,629,067 people shows a significant negative correlation between the proportion of Hawaiians and per capita income in the United States with a correlation coefficient (R) of -0.635 and weighted average of $39,403. Similarly, the statistical analysis conducted on geographies consisting of 335,371,609 people shows a poor negative correlation between the proportion of Pakistanis and per capita income in the United States with a correlation coefficient (R) of -0.132 and weighted average of $45,587, a difference of 15.7%.
Per Capita Income Correlation Summary
| Measurement | Hawaiian | Pakistani |
| Minimum | $14,082 | $8,026 |
| Maximum | $51,335 | $94,275 |
| Range | $37,253 | $86,249 |
| Mean | $33,620 | $41,080 |
| Median | $33,340 | $41,744 |
| Interquartile 25% (IQ1) | $28,161 | $31,965 |
| Interquartile 75% (IQ3) | $40,110 | $46,855 |
| Interquartile Range (IQR) | $11,949 | $14,890 |
| Standard Deviation (Sample) | $7,838 | $13,251 |
| Standard Deviation (Population) | $7,785 | $13,186 |
Similar Demographics by Per Capita Income
Demographics Similar to Hawaiians by Per Capita Income
In terms of per capita income, the demographic groups most similar to Hawaiians are Nicaraguan ($39,372, a difference of 0.080%), Immigrants from Middle Africa ($39,529, a difference of 0.32%), Alaska Native ($39,558, a difference of 0.39%), Osage ($39,568, a difference of 0.42%), and Jamaican ($39,231, a difference of 0.44%).
| Demographics | Rating | Rank | Per Capita Income |
| Japanese | 1.4 /100 | #249 | Tragic $39,870 |
| Immigrants | Burma/Myanmar | 1.3 /100 | #250 | Tragic $39,827 |
| Samoans | 1.3 /100 | #251 | Tragic $39,826 |
| Immigrants | Azores | 1.0 /100 | #252 | Tragic $39,608 |
| Osage | 1.0 /100 | #253 | Tragic $39,568 |
| Alaska Natives | 1.0 /100 | #254 | Tragic $39,558 |
| Immigrants | Middle Africa | 1.0 /100 | #255 | Tragic $39,529 |
| Hawaiians | 0.8 /100 | #256 | Tragic $39,403 |
| Nicaraguans | 0.8 /100 | #257 | Tragic $39,372 |
| Jamaicans | 0.7 /100 | #258 | Tragic $39,231 |
| Malaysians | 0.7 /100 | #259 | Tragic $39,194 |
| Alaskan Athabascans | 0.6 /100 | #260 | Tragic $39,163 |
| Marshallese | 0.6 /100 | #261 | Tragic $39,108 |
| Iroquois | 0.6 /100 | #262 | Tragic $39,104 |
| Belizeans | 0.6 /100 | #263 | Tragic $39,097 |
Demographics Similar to Pakistanis by Per Capita Income
In terms of per capita income, the demographic groups most similar to Pakistanis are Slovene ($45,581, a difference of 0.010%), Jordanian ($45,605, a difference of 0.040%), Immigrants from North Macedonia ($45,622, a difference of 0.080%), Arab ($45,662, a difference of 0.16%), and Luxembourger ($45,663, a difference of 0.17%).
| Demographics | Rating | Rank | Per Capita Income |
| Palestinians | 91.6 /100 | #126 | Exceptional $45,790 |
| Immigrants | Germany | 91.3 /100 | #127 | Exceptional $45,751 |
| Swedes | 91.3 /100 | #128 | Exceptional $45,750 |
| Luxembourgers | 90.4 /100 | #129 | Exceptional $45,663 |
| Arabs | 90.4 /100 | #130 | Exceptional $45,662 |
| Immigrants | North Macedonia | 90.0 /100 | #131 | Exceptional $45,622 |
| Jordanians | 89.9 /100 | #132 | Excellent $45,605 |
| Pakistanis | 89.7 /100 | #133 | Excellent $45,587 |
| Slovenes | 89.6 /100 | #134 | Excellent $45,581 |
| Hungarians | 87.9 /100 | #135 | Excellent $45,426 |
| Immigrants | Oceania | 85.2 /100 | #136 | Excellent $45,220 |
| Immigrants | Syria | 85.2 /100 | #137 | Excellent $45,218 |
| Assyrians/Chaldeans/Syriacs | 84.8 /100 | #138 | Excellent $45,195 |
| Basques | 83.2 /100 | #139 | Excellent $45,086 |
| Immigrants | Jordan | 82.9 /100 | #140 | Excellent $45,066 |