Dutch vs Immigrants from Nicaragua Median Family Income
COMPARE
Dutch
Immigrants from Nicaragua
Median Family Income
Median Family Income Comparison
Dutch
Immigrants from Nicaragua
$101,192
MEDIAN FAMILY INCOME
31.9/ 100
METRIC RATING
185th/ 347
METRIC RANK
$88,267
MEDIAN FAMILY INCOME
0.1/ 100
METRIC RATING
286th/ 347
METRIC RANK
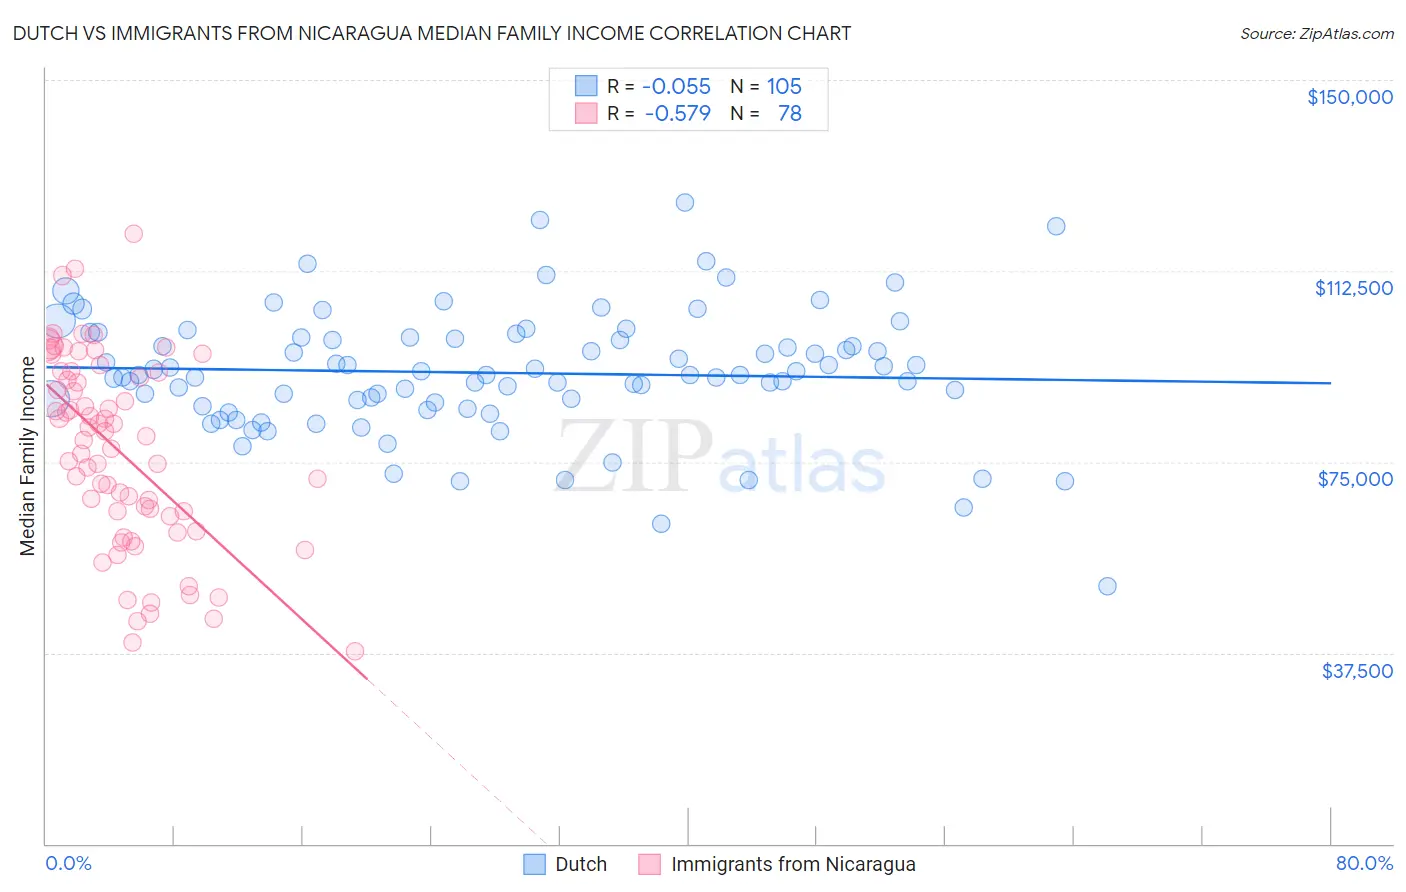
Dutch vs Immigrants from Nicaragua Median Family Income Correlation Chart
The statistical analysis conducted on geographies consisting of 553,300,632 people shows a slight negative correlation between the proportion of Dutch and median family income in the United States with a correlation coefficient (R) of -0.055 and weighted average of $101,192. Similarly, the statistical analysis conducted on geographies consisting of 236,310,703 people shows a substantial negative correlation between the proportion of Immigrants from Nicaragua and median family income in the United States with a correlation coefficient (R) of -0.579 and weighted average of $88,267, a difference of 14.6%.
Median Family Income Correlation Summary
| Measurement | Dutch | Immigrants from Nicaragua |
| Minimum | $50,679 | $37,806 |
| Maximum | $126,042 | $119,688 |
| Range | $75,363 | $81,882 |
| Mean | $92,505 | $77,073 |
| Median | $92,000 | $79,725 |
| Interquartile 25% (IQ1) | $86,239 | $64,231 |
| Interquartile 75% (IQ3) | $99,471 | $92,500 |
| Interquartile Range (IQR) | $13,232 | $28,269 |
| Standard Deviation (Sample) | $12,293 | $18,710 |
| Standard Deviation (Population) | $12,235 | $18,590 |
Similar Demographics by Median Family Income
Demographics Similar to Dutch by Median Family Income
In terms of median family income, the demographic groups most similar to Dutch are Celtic ($101,139, a difference of 0.050%), Tlingit-Haida ($101,092, a difference of 0.10%), Guamanian/Chamorro ($101,061, a difference of 0.13%), Immigrants from Costa Rica ($101,354, a difference of 0.16%), and Immigrants from Portugal ($100,984, a difference of 0.21%).
| Demographics | Rating | Rank | Median Family Income |
| Welsh | 43.3 /100 | #178 | Average $102,151 |
| South Americans | 39.7 /100 | #179 | Fair $101,856 |
| French Canadians | 37.0 /100 | #180 | Fair $101,634 |
| Spaniards | 36.8 /100 | #181 | Fair $101,617 |
| Tsimshian | 35.9 /100 | #182 | Fair $101,543 |
| Kenyans | 34.5 /100 | #183 | Fair $101,417 |
| Immigrants | Costa Rica | 33.7 /100 | #184 | Fair $101,354 |
| Dutch | 31.9 /100 | #185 | Fair $101,192 |
| Celtics | 31.3 /100 | #186 | Fair $101,139 |
| Tlingit-Haida | 30.8 /100 | #187 | Fair $101,092 |
| Guamanians/Chamorros | 30.5 /100 | #188 | Fair $101,061 |
| Immigrants | Portugal | 29.6 /100 | #189 | Fair $100,984 |
| Immigrants | Immigrants | 29.4 /100 | #190 | Fair $100,962 |
| Colombians | 27.2 /100 | #191 | Fair $100,750 |
| Immigrants | Kenya | 26.5 /100 | #192 | Fair $100,679 |
Demographics Similar to Immigrants from Nicaragua by Median Family Income
In terms of median family income, the demographic groups most similar to Immigrants from Nicaragua are Potawatomi ($88,265, a difference of 0.0%), Guatemalan ($88,295, a difference of 0.030%), Indonesian ($88,301, a difference of 0.040%), Cherokee ($88,209, a difference of 0.070%), and Bangladeshi ($88,358, a difference of 0.10%).
| Demographics | Rating | Rank | Median Family Income |
| Immigrants | Belize | 0.1 /100 | #279 | Tragic $89,197 |
| British West Indians | 0.1 /100 | #280 | Tragic $88,987 |
| Blackfeet | 0.1 /100 | #281 | Tragic $88,717 |
| Comanche | 0.1 /100 | #282 | Tragic $88,556 |
| Bangladeshis | 0.1 /100 | #283 | Tragic $88,358 |
| Indonesians | 0.1 /100 | #284 | Tragic $88,301 |
| Guatemalans | 0.1 /100 | #285 | Tragic $88,295 |
| Immigrants | Nicaragua | 0.1 /100 | #286 | Tragic $88,267 |
| Potawatomi | 0.1 /100 | #287 | Tragic $88,265 |
| Cherokee | 0.1 /100 | #288 | Tragic $88,209 |
| Central American Indians | 0.1 /100 | #289 | Tragic $88,034 |
| Shoshone | 0.1 /100 | #290 | Tragic $87,872 |
| Immigrants | Cabo Verde | 0.1 /100 | #291 | Tragic $87,830 |
| Africans | 0.1 /100 | #292 | Tragic $87,820 |
| Ute | 0.0 /100 | #293 | Tragic $87,596 |